Introduction
Some time ago I had to help a customer in a PoC over the implementation of ELK Stack (ElasticSearch, Logstash and Kibana) on Azure VMs using Azure CLI. Then here are all steps you should follow to implement something similar.
Please note you have different options to deploy and use ElasticSearch on Azure
Data Flow
The illustration below refers to the logical architecture implemented to prove the concept. This architecture includes an application server, the Azure Redis service, a server with Logstash, a server with ElasticSearch and a server with Kibana and Nginx installed.
DescrDescription of components
Application Server: To simulate an application server generating logs, a script was used that generates logs randomly. The source code for this script is available at https://github.com/bitsofinfo/log-generator. It was configured to generate the logs in /tmp/log-sample.log.
Filebeat: Agent installed on the application server and configured to send the generated logs to Azure Redis. Filebeat has the function of shipping the logs using the lumberjack protocol.
Azure Redis Service: Managed service for in-memory data storage. It was used because search engines can be an operational nightmare. Indexing can bring down a traditional cluster and data can end up being reindexed for a variety of reasons. Thus, the choice of Redis between the event source and parsing and processing is only to index/parse as fast as the nodes and databases involved can manipulate this data allowing it to be possible to extract directly from the flow of events instead to have events being inserted into the pipeline.
Logstash: Processes and indexes the logs by reading from Redis and submitting to ElasticSearch.
ElasticSearch: Stores logs
Kibana/Nginx: Web interface for searching and viewing the logs that are proxied by Nginx
Deployment
The deployment of the environment is done using Azure CLI commands in a shell script. In addition to serving as documentation about the services deployed, they are a good practice on IaC. In this demo I'll be using Azure Cloud Shell once is fully integrated to Azure. Make sure to switch to Bash:
The script will perform the following steps:
- Create the resource group
- Create the Redis service
- Create a VNET called myVnet with the prefix 10.0.0.0/16 and a subnet called mySubnet with the prefix 10.0.1.0/24
- Create the Application server VM
- Log Generator Installation/Configuration
- Installation / Configuration of Filebeat
- Filebeat Start
- Create the ElasticSearch server VM
- Configure NSG and allow access on port 9200 for subnet 10.0.1.0/24
- Install Java
- Install/Configure ElasticSearch
- Start ElasticSearch
- Create the Logstash server VM
- Install/Configure Logstash
- Start Logstash
- Create the Kibana server VM
- Configure NSG and allow access on port 80 to 0.0.0.0/0
- Install/Configure Kibana and Nginx
Note that Linux User is set to elk. Public and private keys will be generated in ~/.ssh. To access the VMs run ssh -i ~/.ssh /id_rsa elk@ip
Script to setup ELK Stack
The script is available here. Just download then execute the following:
wget https://raw.githubusercontent.com/ricmmartins/elk-stack-azure/main/elk-stack-azure.sh
chmod a+x elk-stack-azure.sh
./elk-stack-azure.sh <resource group name> <location> <redis name>
After a few minutes the execution of the script will be completed, then you have just to finish the setup through Kibana interface.
Finishing the setup
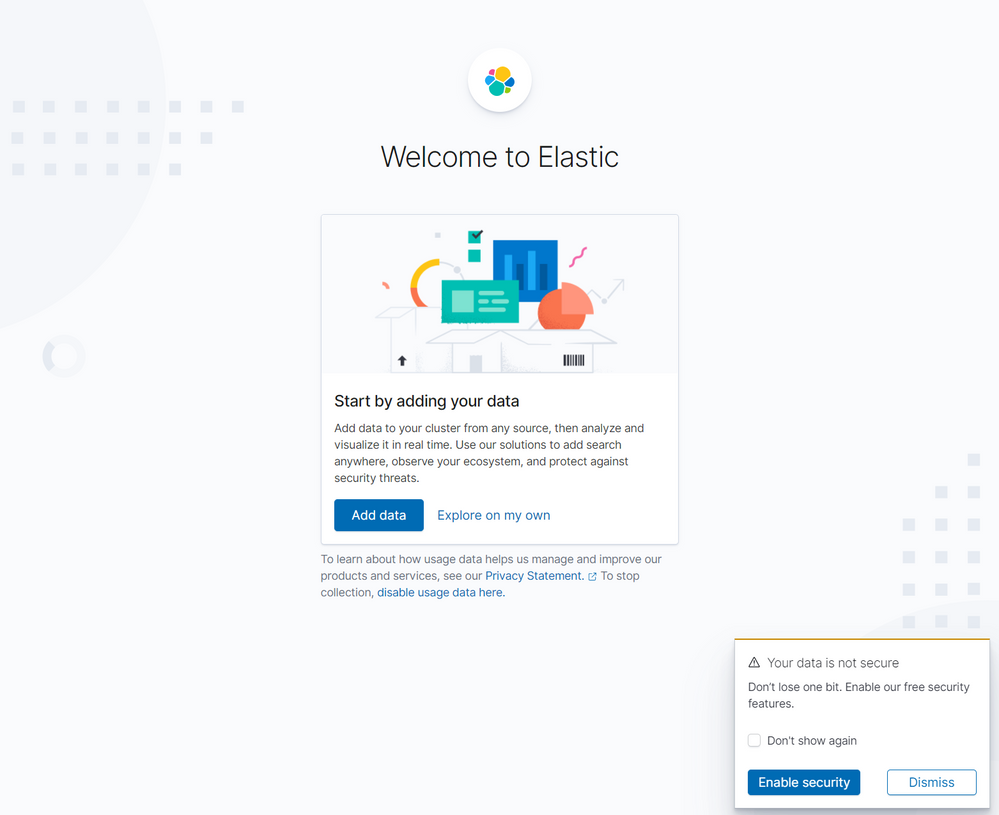
To finish the setup, the next step is to connect to the public IP address of the Kibana/Nginx VM. Once connected, the home screen should look like this:
Then click to create Explore my own. In the next screen click on Discover
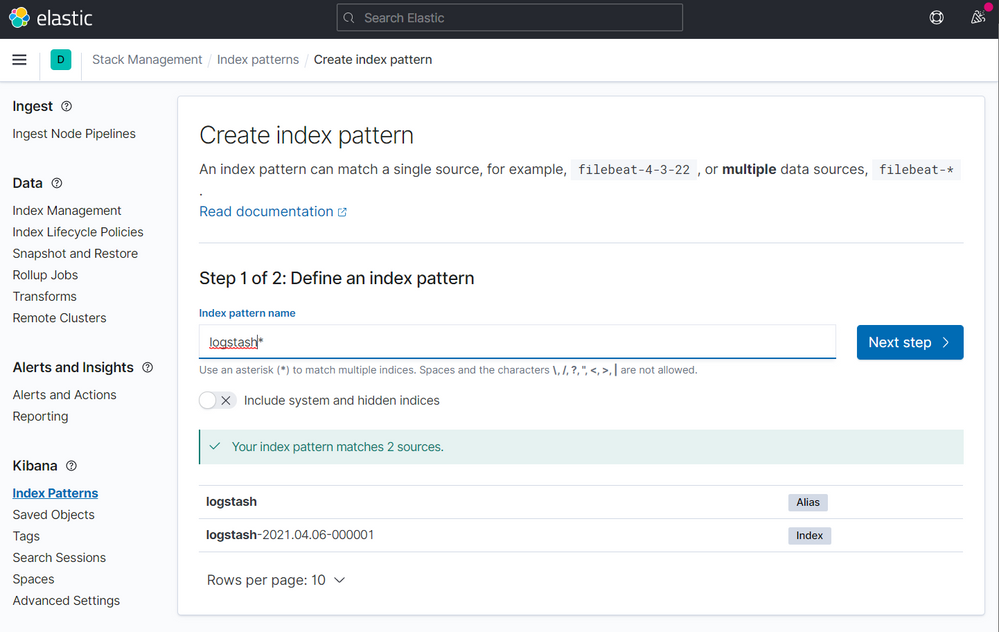
Now click on Create index pattern
On the next screen type logstash on the step 1 of 2, then click to Next step
On the step 2 of 2, point to @timestamp
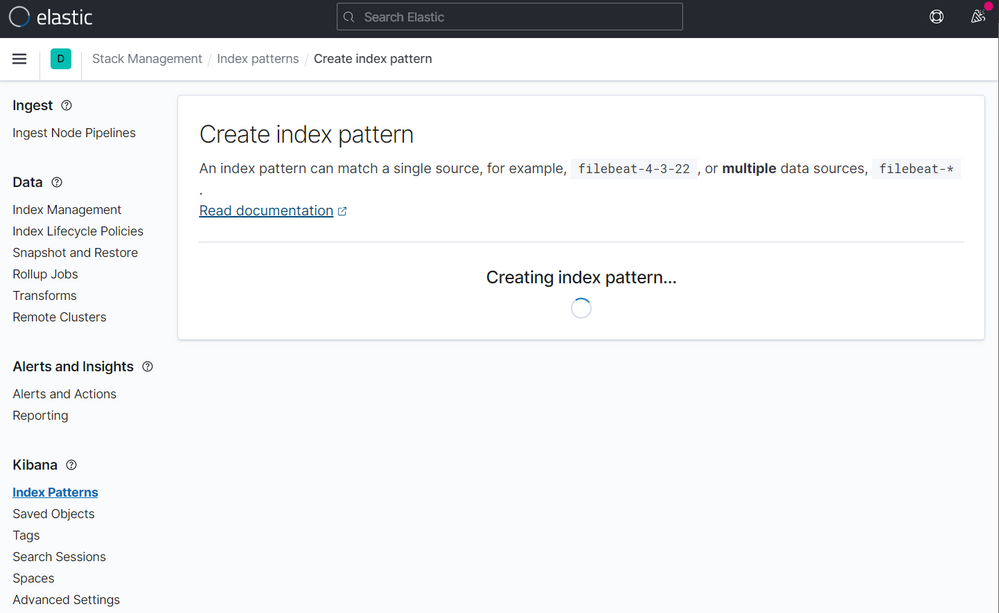
Then click to Create index pattern
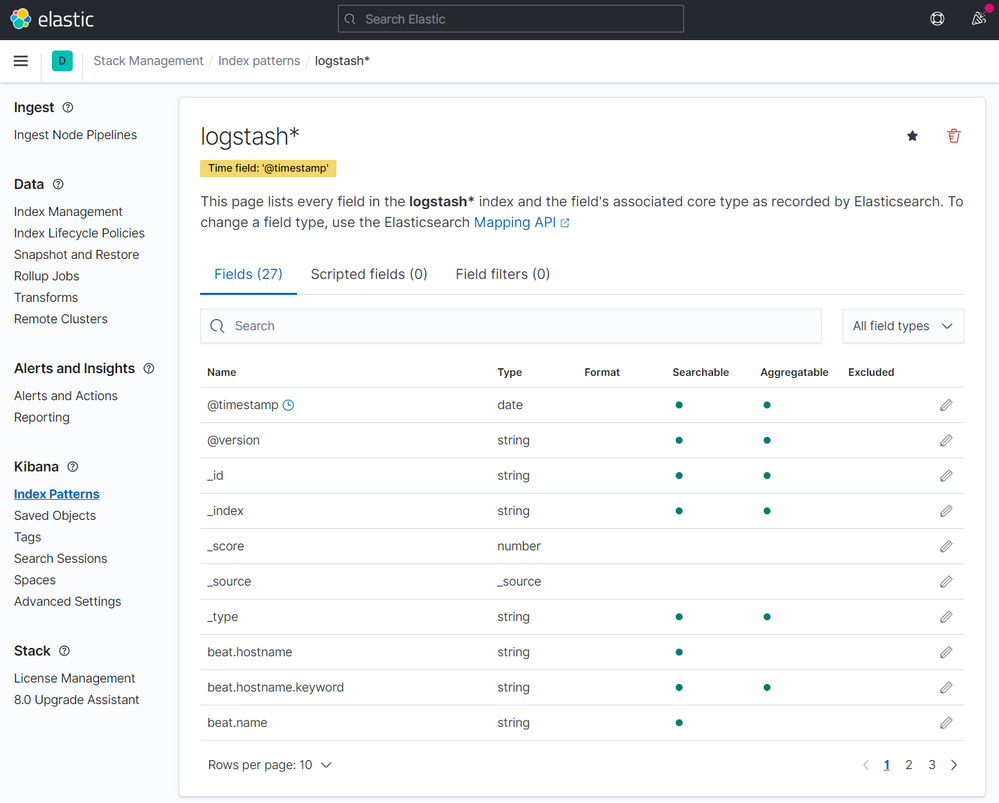
After a few seconds you will have this:
Click on Discover on the menu
Now you have access to all indexed logs and the messages generated by Log Generator:
Final notes
As mentioned earlier, this was done for a PoC purposes. If you want add some extra layer for security, you can restrict the access adding HTTP Basic Authentication for NGINX or restricting the access trough private IPs and a VPN.
Posted at https://sl.advdat.com/3vAjKNw


