Hi folks!!
Simone is back to you.
Probably, most of you know that when you enable Azure Activity connector in Azure Sentinel Connector’ s blade almost every audit log generated from Azure resources is saved in the AzureActivity Table.
Well, almost does not mean all :) In fact, from the Azure portal we can only manage the subscriptions level, but some audits created by the Root management group are not collected by default by the Azure Sentinel collectors.
For example, operations logged by the Microsoft.Management resource provider are not available at root level as creation/move/delete of subscriptions.
To keep under control these logs we can configure the audit using the Azure Monitor REST API following the steps below:
- Under management groups take the “tenant root group ID” (ManagementGroupID) and Name
- Open the link Management Group Diagnostic Settings - Get - REST API (Azure Monitor) | Microsoft Docs
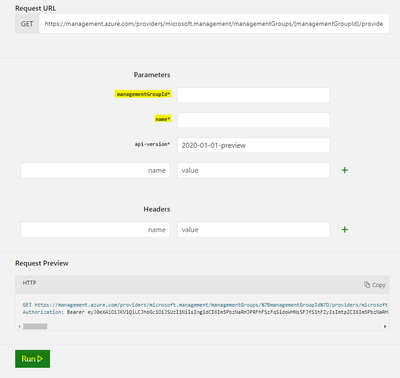
Try to get the setting from tenant root - Sign in and fill the fields with ManagementGroupID and Name and click RUN at the bottom of the page:
- Now we should create or update Diagnostic Setting
Management Group Diagnostic Settings – Create Or Update – REST API (Azure Monitor) | Microsoft Docs –
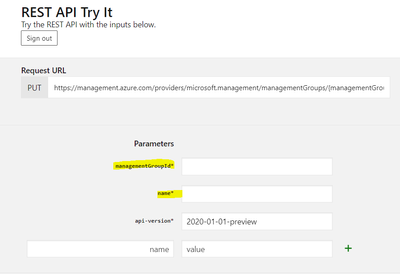
Click on Try
- Fill the fields with TenantId and Name as already done before at 3 Step:
- Copy the JSON schema Template from this link Resource Manager template samples for diagnostic settings - Azure Monitor | Microsoft Docs:
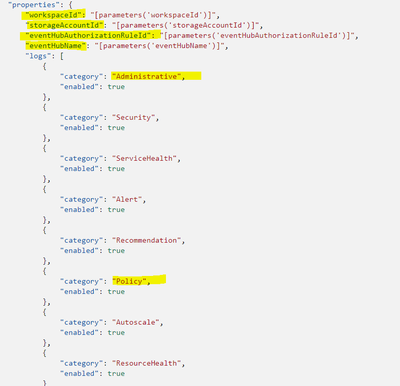
- Modify the setting related to the repository (Log Analytics, Event Hub, Storage Account), and define the categories that you wish to collect, in our case Administrative and Policy
- in case you don’t need the other setting, you can delete the specific line:
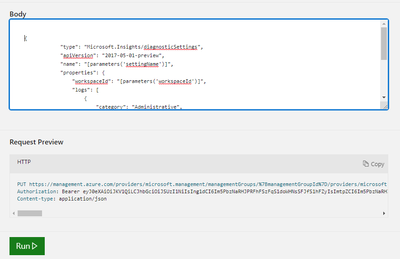
- Paste the Json in the box “body” and click RUN:
{
"type": "Microsoft.Insights/diagnosticSettings",
"apiVersion": "2017-05-01-preview",
"name": "[parameters('settingName')]",
"properties": {
"workspaceId": "[parameters('workspaceId')]",
"logs": [
{
"category": "Administrative",
"enabled": true
},
{
"category": "Policy",
"enabled": true
}
]
}
}
Do you like automation and powershell?
No problem!! My colleague @Martin Schvartzman wrote and share a cool powershell script.
Let's check it
https://github.com/martin77s/Azure/blob/master/PS/Enable-DiagnosticSettingsMG.ps1
I hope it will help you, save some time as well as some headaches!
See you next time!
Simone
Posted at https://sl.advdat.com/3wGk262


