The following procedure guides on how to properly collect memory dumps to study exceptions leading to a process crash. This post complements my article about how exceptions are handled and how to collect memory dumps to study them.
Although both ProcDump and DebugDiag can collect memory dumps for the monitored process under certain conditions - such as when specific exceptions occur – in this scenario, only DebugDiag is flexible enough. DebugDiag automates some steps, adds more explicit context, and includes automated memory dump analysis capabilities too.
The steps below have limited applicability – when we know for sure that a certain first-chance exception shortly precedes and causes a crash. All second-chance (crash causing) exceptions start as first-chance ones; in general, it is enough to look at the exception in its final stage. But there are edge cases where we need to study both the first-chance context and the crashing one.
Using the UI tool DebugDiag, Debug Diagnostics Collection
DebugDiag requires installation, but it is able to determine itself the whatever process instance - PID - happens to execute for an application pool at some point in time; even when that process may occasionally crash, hence restart with different PID.
#1.
Download Debug Diagnostic and install it on IIS machine:
https://www.microsoft.com/en-us/download/details.aspx?id=49924 v2.2 (if 32-bit system)
https://www.microsoft.com/en-us/download/details.aspx?id=102635 v2.3.1 (only supports 64-bit)
#2.
Open Debug Diagnostic Collection.
If a wizard does not show up, click Add Rule.
#3.
Choose Crash and click next.
#4.
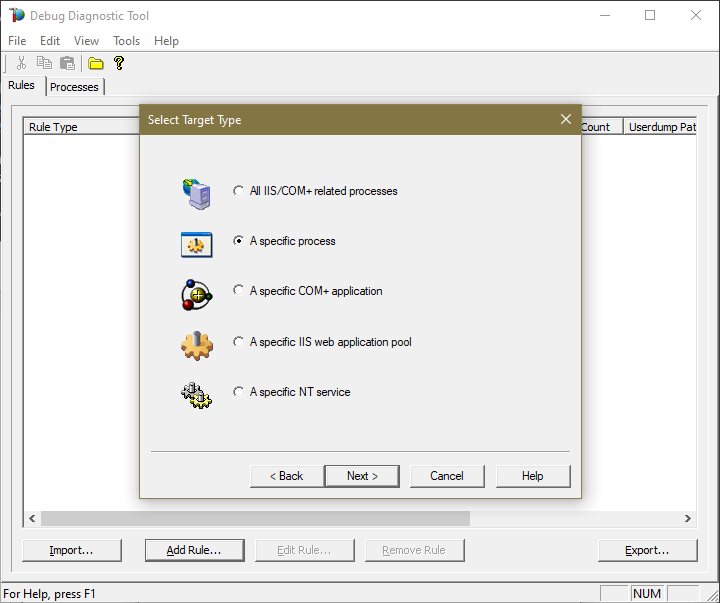
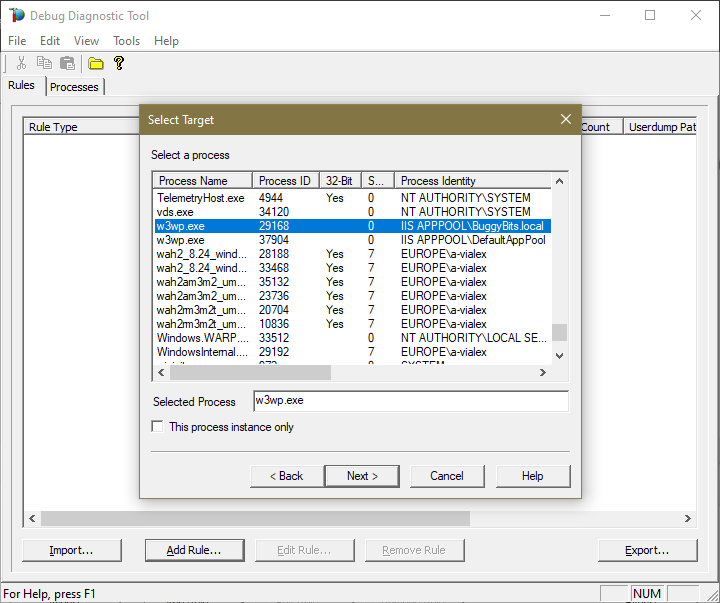
Choose A specific process and next. Or
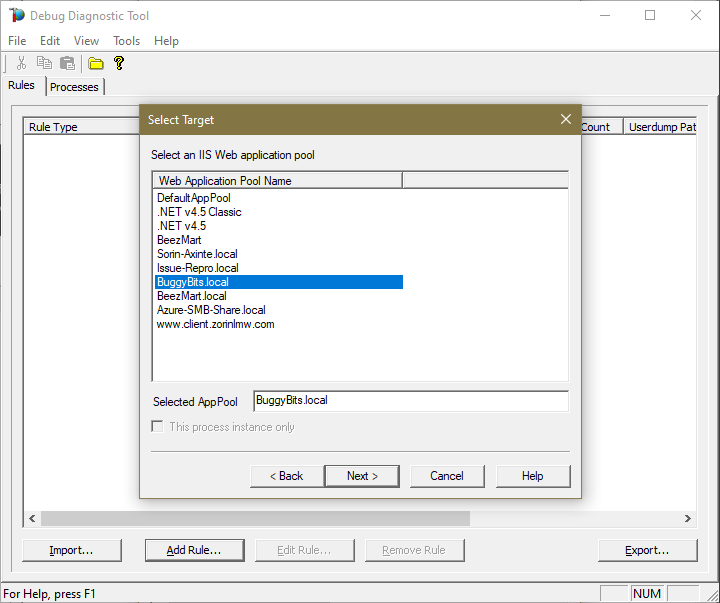
Choose A specific IIS web application pool and next.
#5.
Identify and select the exact process that we’re interested in. Or…
Choose the Application Pool of which w3wp.exe worker processes are crashing.
#6.
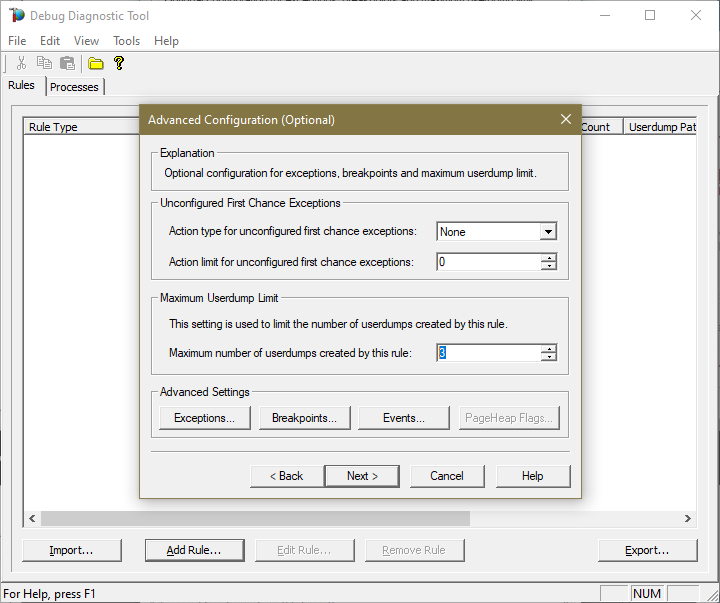
Lower the Maximum number of user-dumps created by the rule to 3.
#7.
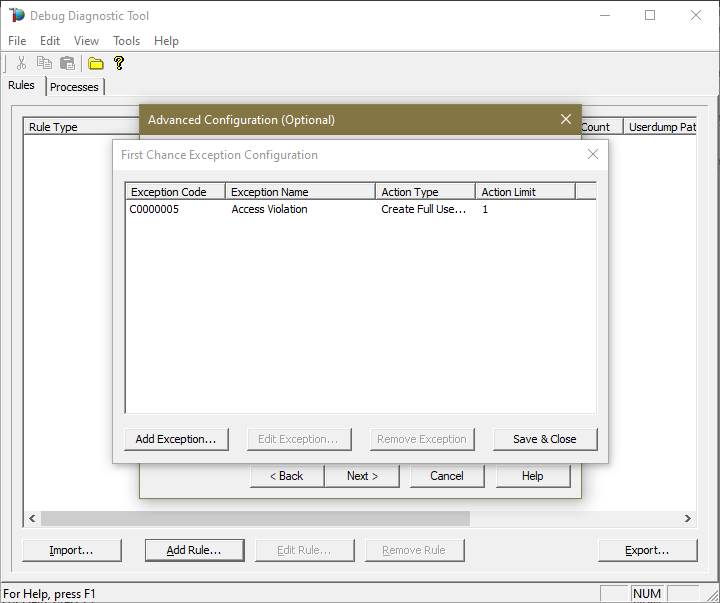
Click on the Exceptions button to also collect a first-chance exception for that Access Violation.
#8.
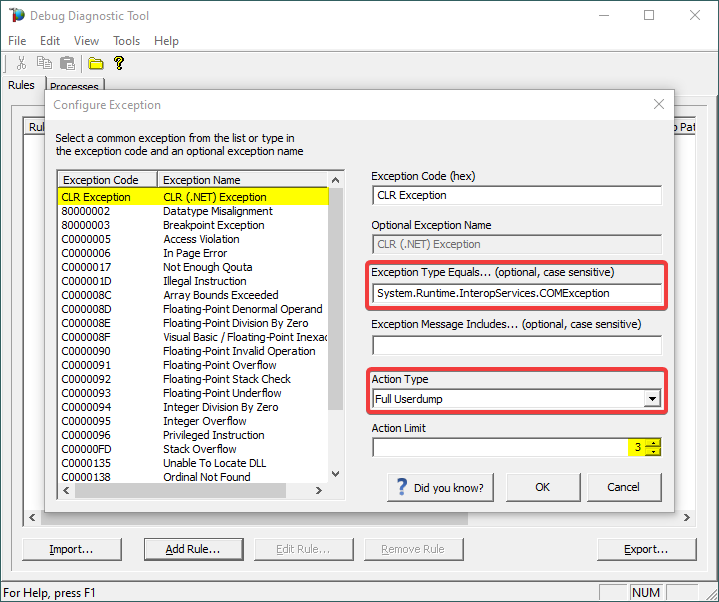
Click on the Add Exception button. In the Configure Exception window:
In most cases if not all, the first-chance exception is a CRL Exception; but since all CLR exceptions will have native code
E0434352, be sure to filter out by full exception name or a string in the exception message.
Action Type = Full Userdump
Action Limit = 1
#9.
Click OK in the Configure Exception window, then
Save & Close in the First Chance Exception Configuration window.
#10.
Click Next and configure the file location where the dump file(s) will be generated.
Please make sure that there is enough disk space on the drive where dumps are collected. Each process dump will take space in the disk approximately the same size the process uses in memory (column Commit Size in Task Manager). For example, if the w3wp.exe process memory usage is ~2 GB, then the size of each dump file will be around 2 GB.
Please do not choose a disk in network/UNC; choose a local disk.
#11.
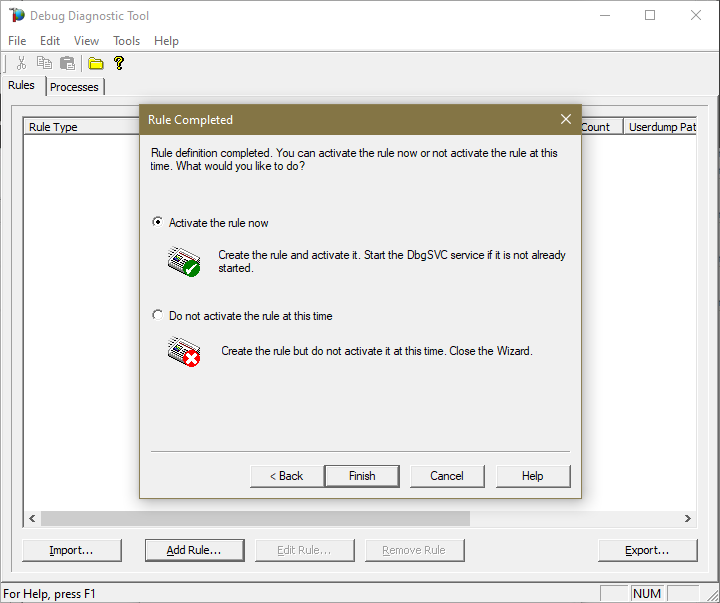
Click Next and Finish by selecting to Activate the rule now.
#12.
When the same event is logged, a dump file (or files) should be created in the user-dump location selected above.
Monitoring logs are also generated: Debug Diag reports all exceptions (including the first-chance ones) that occurred in the process.
- Look for a file like below, in the folder configured for the rule (where dumps would be saved):
<processName>__<appPool>__PID__<PID>__Date__MM_DD_YYYY__Time_hh_mm_ss<AM|PM>__<ID>__Log.txt - Example:
w3wp__SCEP__PID__10032__Date__07_20_2021__Time_11_03_39AM__492__Log.txt
Please archive in a ZIP and prepare to hand over to the support engineer; upload in a secure file transfer space.
Remember my article about how exceptions are handled and how to collect memory dumps to study them. We can double check if a crash occurred or not: read about w3wp.exe crashes.
Aside: Just in case you are wondering what I use to capture screenshots for illustrating my articles, check out this little ShareX application in Windows Store.
Posted at https://sl.advdat.com/3x0evr8

