You should be using this method when the slow processing is hard to predict, so you would rather let a monitoring tool to trigger the dump collection when issue is manifesting. If you can witness the IIS performance issue, you could apply these steps instead.
We’re looking for IIS w3wp.exe worker process dumps taken approximately 10 seconds from one another.
Usually a series of 5 dumps taken on same process ID are enough. We can draw some conclusions on what’s happening within that process at the moments when dumps are taken: the threads, the memory/objects in that process, the dependency connections, (dead)locks etc.
IIS is immediately restarting a w3wp.exe worker process if a crash is happening. If that happens, the memory of the initial process is gone. This is why I highlight: same process ID.
Taking a series of dump manually is not easy, because you need to move fast and precisely during those seconds when the performance issue occurs.
Leaving too many seconds (or worse, minutes) between dumps would decrease your chances to capture the conditions leading to poor performance.
So, we employ DebugDiag. This very popular tool is able to monitor a process (or processes created for a specific IIS application pool), and collect the memory dumps(s) based on events that you specify when you configure a rule.
#1.
Download Debug Diagnostic and install it on IIS machine:
https://www.microsoft.com/en-us/download/details.aspx?id=49924 v2.2 (if 32-bit system)
https://www.microsoft.com/en-us/download/details.aspx?id=102635 v2.3.1 (only supports 64-bit OS)
#2.
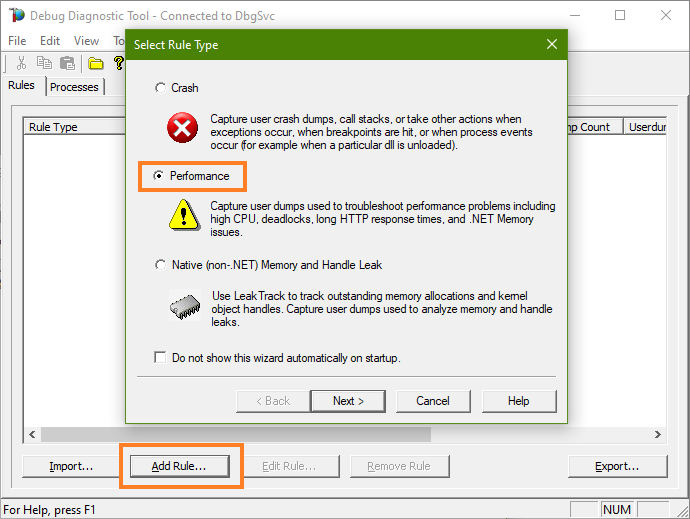
Open Debug Diagnostic Collection.
If the “Rule wizard” does not appear, please click on the Add Rule button.
We're setting a dump collection rule for Performance investigation.
#3.
Select the HTTP Response Times as trigger for the memory dump collection.
Then click Next.
#4.
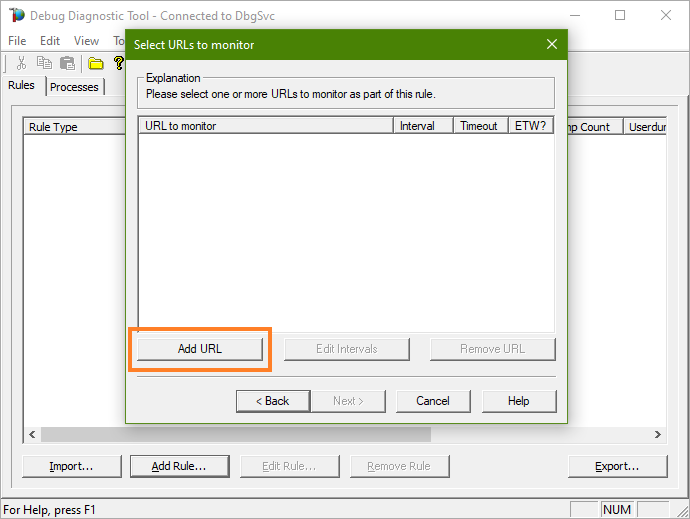
In the new wizard step, Select URLs to monitor, click Add URL button.
#5.
In the Properties of URL to monitor,
check Use ETW to monitor incoming requests, then
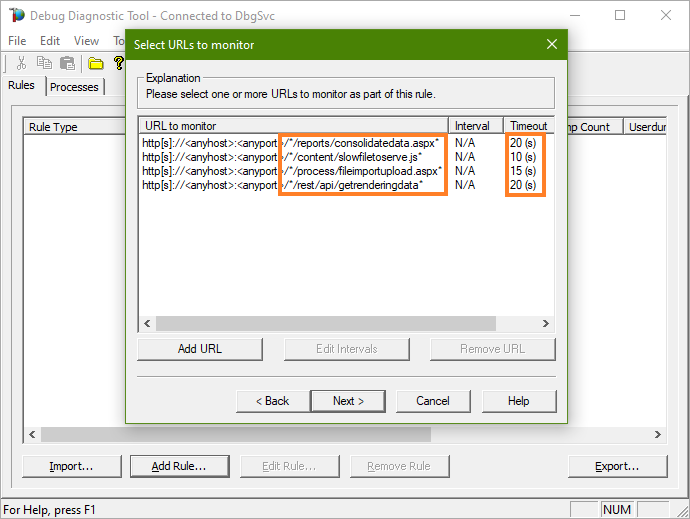
type part of the URL, to filter the requests to ones we're interested in, like illustrated below.
Lower the default Timeout interval (120 seconds) to something more suitable, maybe 30 seconds or less, depending on your realistic expectations.
Then click OK.
Several URLs may be monitored, to trigger a dump collection, each with its own maximum time we expect for serving.
Once we added URL(s), click next in the Select URLs to monitor window.
#6.
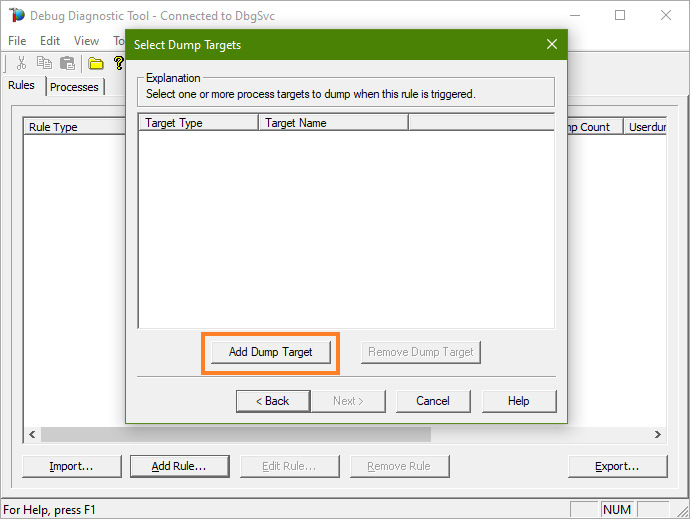
In the Select Dump Targets window, click to Add Dump Target.
We're telling what process will be memory-dumped.
#7.
In the Add Dump Target, pick Web Application Pool from the drop-down, then select the application pool executing your app.
We're dumping whatever w3wp.exe PID happens to be working for that application pool.
#8.
Then, when back in the Select Dump Targets window, click Next.
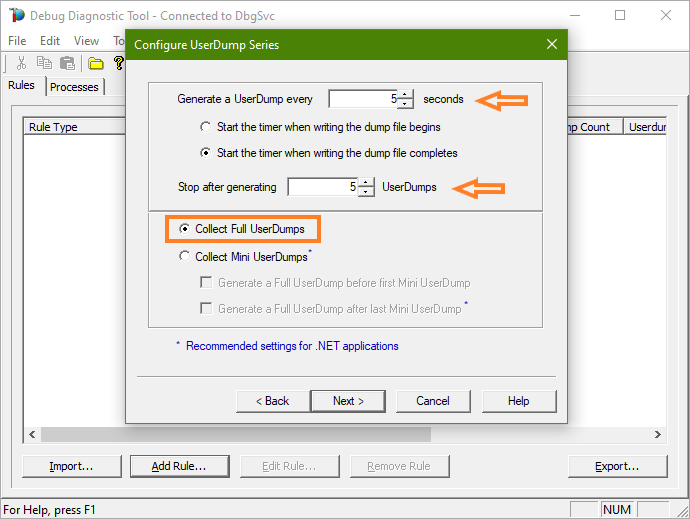
It is always better to have a series of dumps from a process, rather than a single one, especially when studying performance or memory issues.
Dumps should be collected every 5-10 seconds, and 5 of them should suffice (but the more the better).
Very important: Full UserDumps are needed - the entire committed memory of the process.
#9.
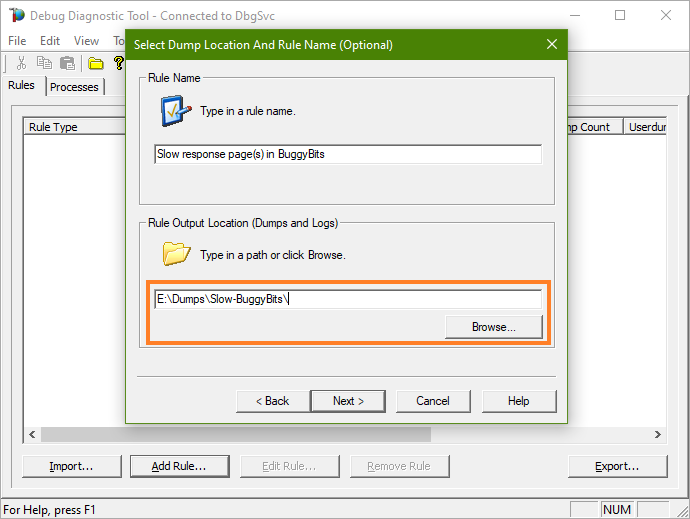
Click Next and configure the file location where the dump file(s) will be generated.
Please make sure that there is enough disk space on the drive where dumps are collected. Each process dump will take space in the disk approximately the same size the process uses in memory (column Commit Size in Task Manager). For example, if the w3wp.exe process memory usage is ~2 GB, then the size of each dump file will be around 2 GB.
Please do not choose a disk in network/UNC; choose a local disk.
#10.
Activate the rule, to have DebugDiag start monitoring the target process(es) with the configured triggers.
#11.
The Rule entry will let you know how many memory dumps have been collected for the monitored process(es).
Look in the Userdump Count column.
#12.
Wait for dump files (.DMP) to be generated and written on disk.
Archive each dump file in its own ZIP and prepare to hand over to the support engineer; upload in a secure file transfer space.
Remember my article about how exceptions are handled and how to collect memory dumps to study them. We can double check if a crash occurred or not: read about w3wp.exe crashes.
Aside: Just in case you are wondering what I use to capture screenshots for illustrating my articles, check out this little ShareX application in Windows Store.
Posted at https://sl.advdat.com/3i5Hndv