When running your Java application in Azure Linux App Service, you may encounter performance related issues like high memory consumption, slow dependency calls, etc.
Java New Relic agent is one of the APM tools that can help to provide a better understanding of what may be causing the performance issues.
This article shows a demonstration of how to use New Relic agent to monitor your Java application running in Linux App Service.
Prerequisites
- A New Relic account.
- Azure App Service for Linux with built-in Java docker image.
Setup and Enable Java New Relic agent
Download Java Newrelic agent:
https://download.newrelic.com/newrelic/java-agent/newrelic-agent/current/newrelic-java.zip
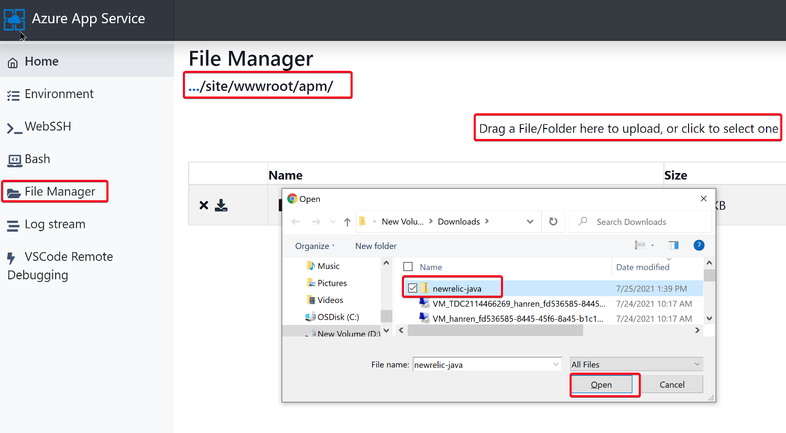
Upload the downloaded newrelic-java.zip file to your Azure App Servic:
- Inside the App Service /home/site/wwwroot folder, create a new "apm" folder
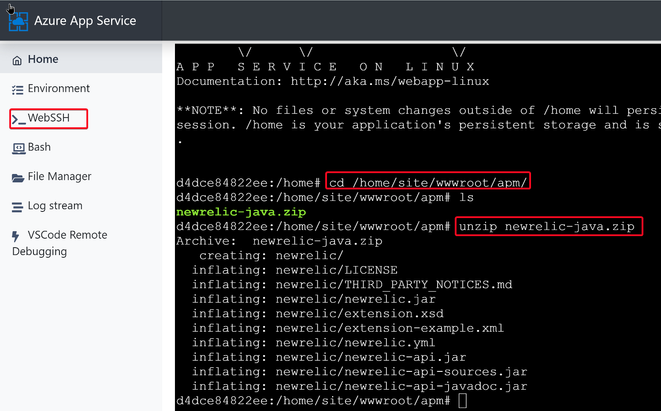
- Go to https://<webapp-name>.scm.azurewebsites.net/newui/webssh
- Use the following command to create a new /home/site/wwwroot/apm folder
mkdir -p /home/site/wwwroot/apm
2. Upload the newrelic-java.zip file to /home/site/wwwroot/apm
3. Decompress the /home/site/wwwroot/apm/newrelic-java.zip
cd /home/site/wwwroot/apm/
unzip newrelic-java.zip
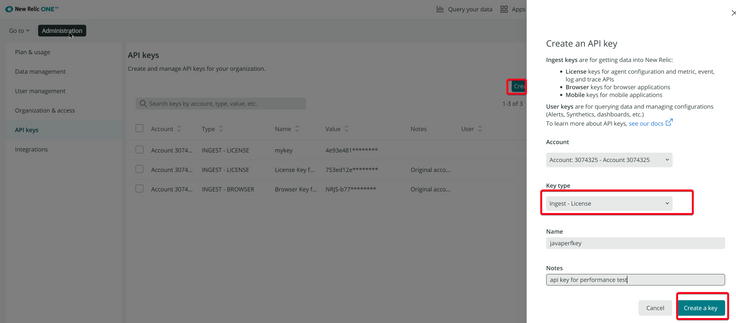
Create Newrelic API keys
Now we need to get the Newrelic API keys by navigating directly to
1. Create "Ingest-License" key in https://one.newrelic.com/launcher/api-keys-ui.api-keys-launcher
2. Copy the new create API key, save it in your local notepad.
Configure your Newrelic setting in Azure App Service
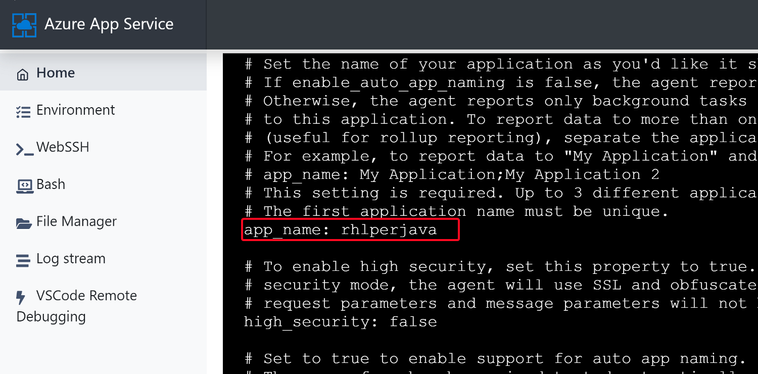
1. Go to App Service WEBSSH https://<webapp-name>.scm.azurewebsites.net/newui/webssh
vi /home/site/wwwroot/apm/newrelic/newrelic.yml
2. Input your Newrelic API Key and
Use ":wq" save the change.
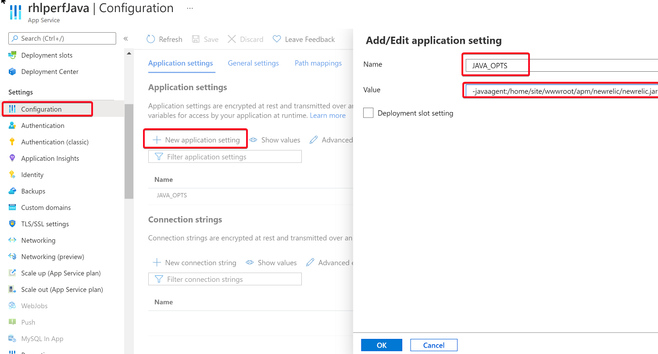
3. In the App Settings, add "JAVA_OPTS" with Newrelic java agent path.
JAVA_OPTS = -javaagent:/home/site/wwwroot/apm/newrelic/newrelic.jar
Save the Application Settings change and web app should be automatically restarted.
Monitor your Java Application Performance in Newrelic
Go to https://one.newrelic.com/
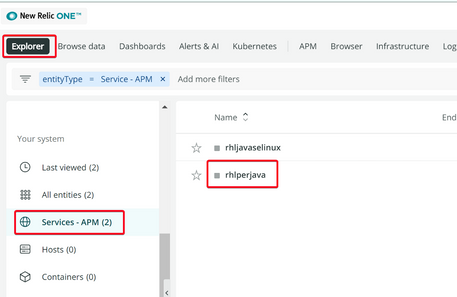
Click "Explorer" tab, in the "Service - APM", we should see your java app showed up in the list. The Name should match your app_name configured in newrelic.yml.
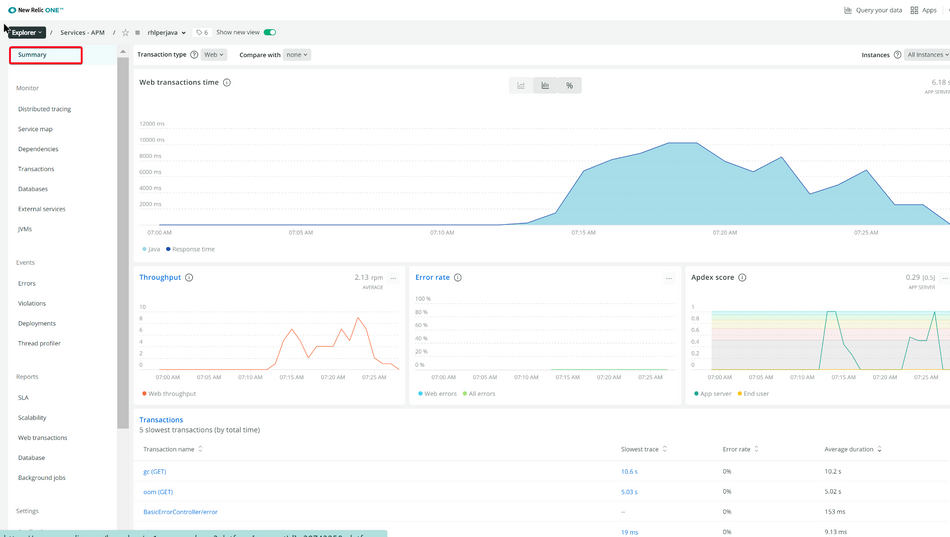
1. Monitor the Application performance Summary.
2. Monitor JVM Memory usage
3. Monitor "Service Map" and "Dependencies"
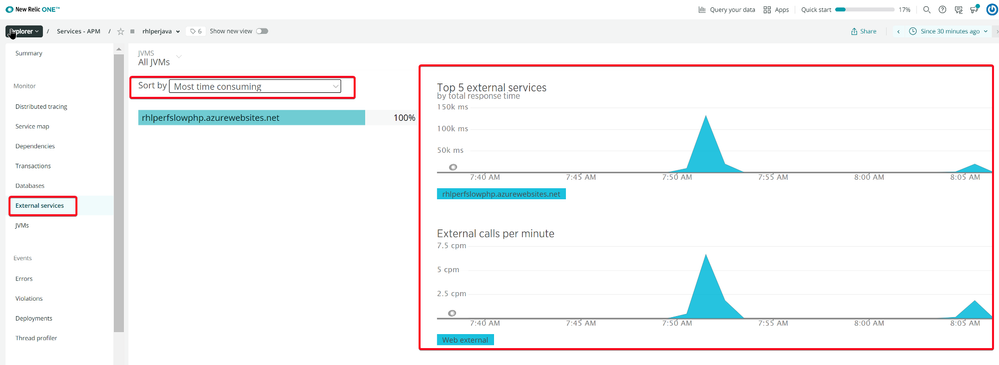
List all the dependencies
Check most time consuming external services
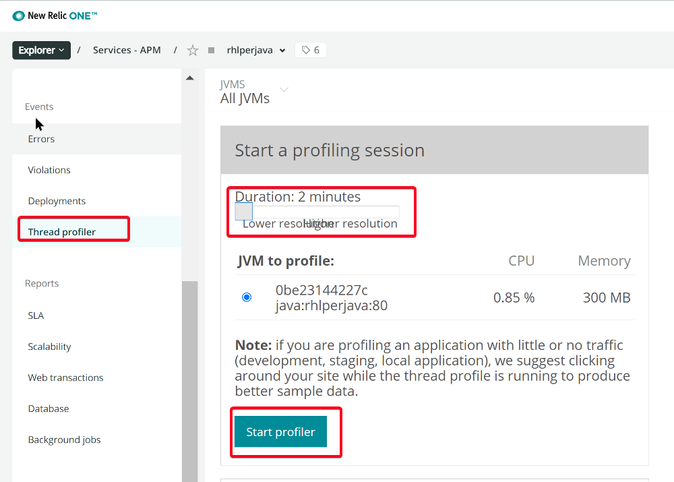
4. Run Thread profiler
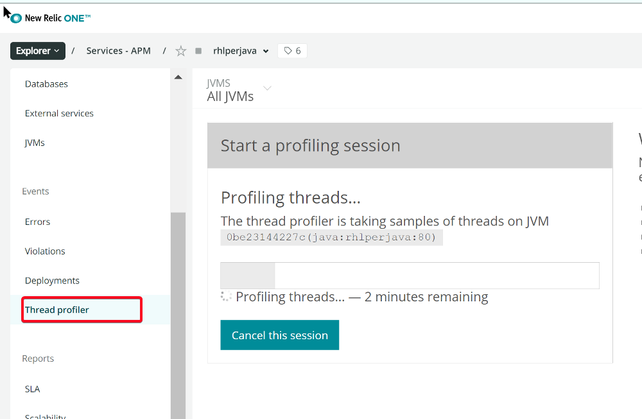
Set profiling Duration, and click "Start profiler"
When the profiling starts, run test over your Java App Service.
For example: send requests to https://<webapp-name>.azurewebsites.net/slowurl
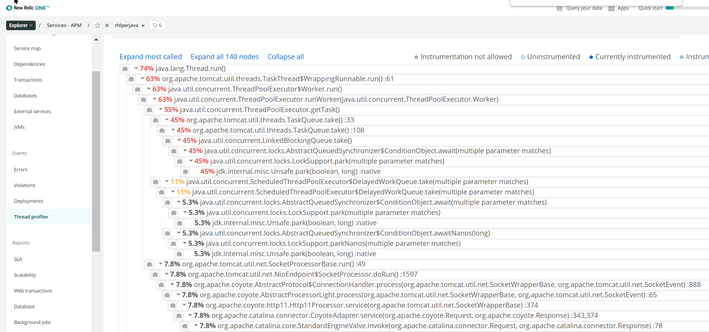
After the profiling completes, you will be able to click "View the results"
Posted at https://sl.advdat.com/3jzuGah

