Azure Data Explorer Insights (ADX Insights) provides a unified view of your clusters' usage, performance, and health. Now, you can monitor ingestion operations from ADX using the new "Ingestion" tab (specifically, batching ingestion).
Here are some questions you can get answers to with ADX Insights:
- What is the result of my ingestion attempts? How many ingestions have succeeded or failed?
- What is the ingestion success rate per table?
- Are there any tables that may be missing data due to ingestion errors? What exactly are the error details?
-
What was the amount of data processed by the ingestion pipeline?
- What is the latency of the ingestion process? Did the latency build up in ADX's pipeline or upstream of ADX?
- How can I better understand how batches are generated during ingestion?
- For ingestion using Event Hub, Event Grid, or IoT Hub, how can I compare the number of events arriving at ADX with the number of events sent for ingestion?
The user experience
On the Azure portal, go to the ADX cluster page > "Insights" blade ()> "Ingestion" tab.
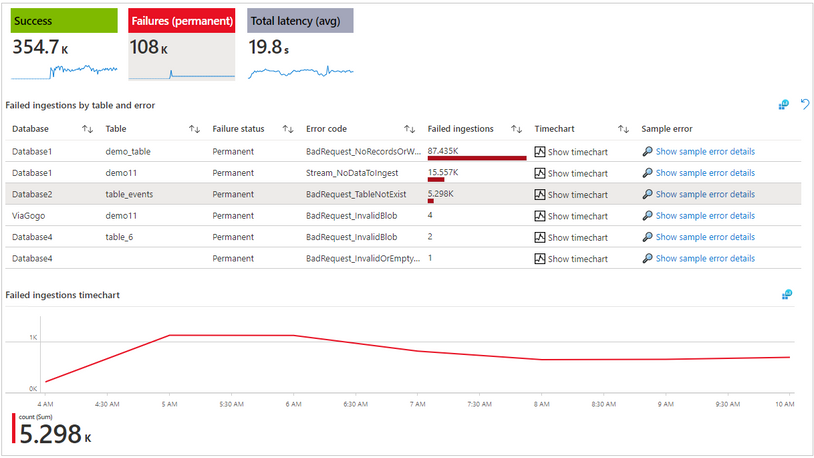
The top of the screen shows a "traffic light" for failed and successful ingestions. These are the number of blobs that were ingested or failed to be ingested. (The ingestion process is performed in blobs. Event Hub and IoT Hub ingestion events are aggregated into a single blob (multiple events per blob) and then processed as a single blob (source) blob for ingestion)


Click on the "Success" or "Failures" tiles to drill down and see more details per database and table, including:
- The number of successful ingestions per table, including the ingestion success rate.
- The number of failed ingestions for each table, along with the status (permanent or transient), error code, and sample error text.
You can use theicon to dig deeper into the log and view more details, for example, a list of other error texts associated with a certain error code.
- A time chart showing successful and failed ingestions over time.
To see table-level details ,make sure to enable the ingestion diagnostic logs and send them to Log-Analytics.
Below that, you will find:
- The "Total latency" (accumulative) - the time from the point at which ADX accepts the data until it is available for query.
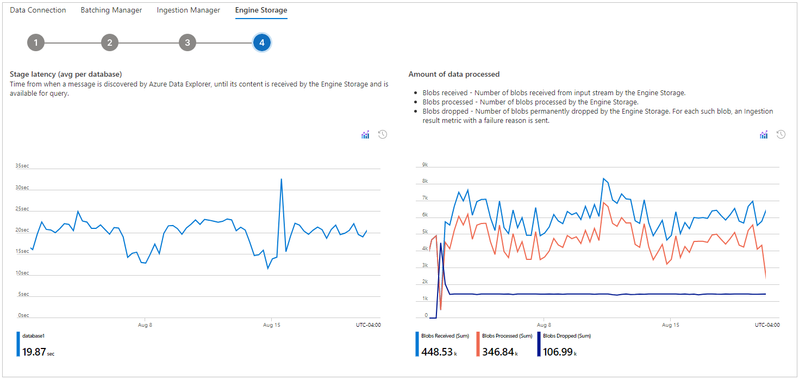
- "Data processed successfully" chart - the number of blobs that were processed by the Storage Engine (The storage engine stores the ingested data so it is available for query.)
Visibility into the ingestion process - understand the batching stages
In the batching ingestion process, Azure Data Explorer optimizes data ingestion for high throughput by batching incoming small chunks of data into batches based on a configurable ingestion batching policy. The batching policy allows you to set the trigger conditions for sealing a batch to be ingested (the conditions are: data size, number of blobs, or time passed). These batches are then optimally ingested for fast query results.
There are four stages to batching ingestion, and there are specific components for each step:
- Data Connection - For Event Grid, Event Hub and IoT Hub ingestion, there is a Data Connection that gets the data from external sources and performs initial data rearrangement.
- The Batching Manager batches the received references to data chunks to optimize ingestion throughput based on a batching policy.
- The Ingestion Manager sends the ingestion command to the ADX Storage Engine.
- The ADX Storage Engine stores the ingested data, making it available for query.
Example:
You can monitor your data connections (per event hub or IoT hub) and track the "received data size" by each data connection.
You can also monitor the "discovery latency" – this is the time frame from data enqueue until data is discovered by ADX. This time frame is upstream to Azure Data Explorer.
When you see a long latency until data is ready for query, analyzing the discovery Latency and the next stage latencies (in the next steps) can help you understand whether the long latency is because of long latency in ADX, or is upstream to ADX.

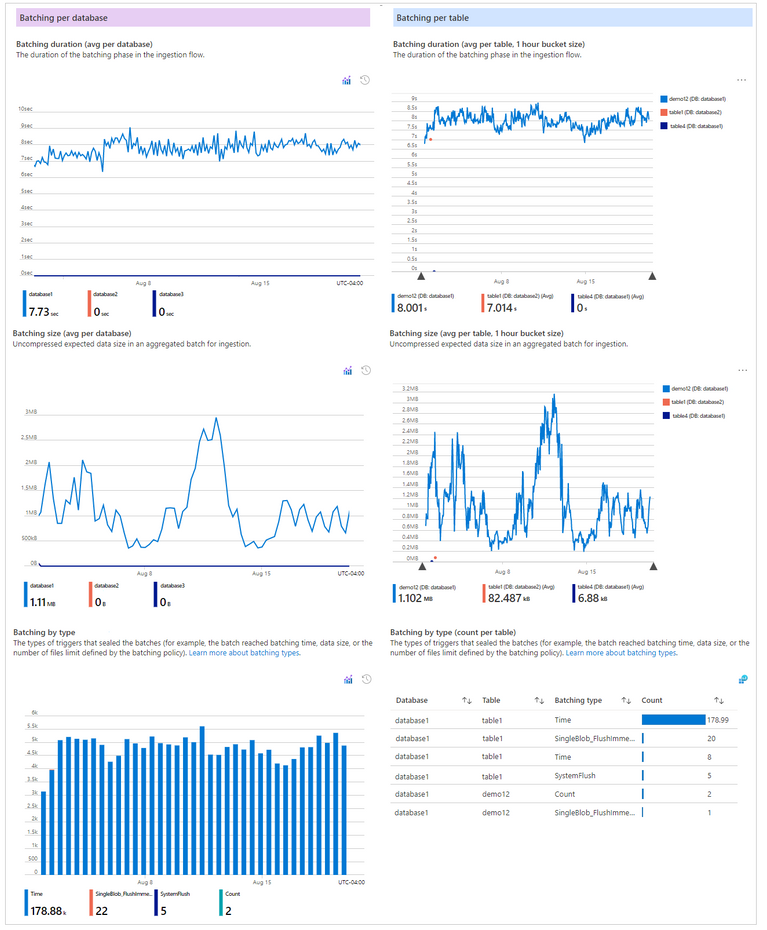
The second stage of the batching ingestion proceeds is the Batching Manager, which optimizes ingestion throughput by batching data based on the ingestion batching policy.
This step allows you to monitor aspects such as:
- Batching duration - the duration of a batch from the moment it is opened to when it is sealed,
- Batch size - uncompressed expected data size in a batch for ingestion.
Batching monitoring
Moreover, you can view "per-table" data: batching duration per table, the batching size per table, and how the batches were sealed per table (as determined by the ingestion batching policy details.)

The 3ed and 4th steps are Ingestion Manager and Engine Storage, respectively. In the Engine Storage, you can see the accumulative latency per database - the time from the moment ADX accepts the data until the data is received by the Engine Storage, and it is available for query.

Feel free to comment on this blog post. You can also use the feedback button (
Posted at https://sl.advdat.com/3jhiuvV