When running your Node.js application in Azure Linux App Service, you may encounter High CPU consumption issue.
v8-profiler-node8 is one of the tools that can help us profile the CPU usage of a Node.js application.
Normally, we need to explicitly insert code to control where to start and stop profiling in the application code. But for complex applications running in production mode, it's hard to decide at which position of the code to start/stop profiling. Also, it will generate too many profiler result files if we continuously profiling a running App Service.
This article describes an idea of how to control the v8 profiler using process signal in Linux App Service.
You can find the detailed steps of:
- How to install and inject v8 CPU profiler in your Node.js application code
- How to capture CPU profiler dump in Linux App Service
- How to use Google Chrome Developer tools to analyze the profiler file.
How to install and inject v8 CPU profiler in your Node.js application code
- Install the "v8-profiler-node8" module
In general, we just need to use npm to install the "heapdump" modulenpm install v8-profiler-node8
For your Node.js application going to deploy to Azure App Service, we can define it in your package.json "dependencies" section like the following: - Then, you need to load the v8-profiler-node8 module into your application
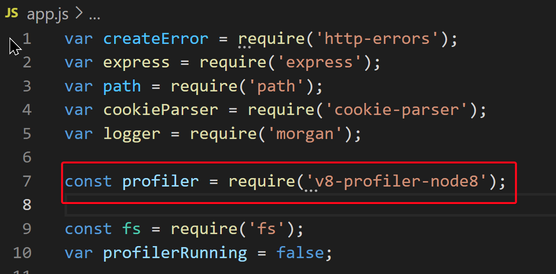
For example, in my Node Express project, I put the following line in my app.js file.
var heapdump = require(' v8-profiler-node8 ') - To make the CPU profiler able to be controlled by process Signal, we can use the following code in the app.js file
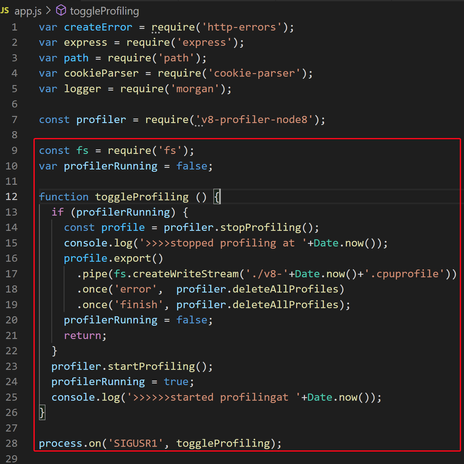
const profiler = require('v8-profiler-node8');
const fs = require('fs');
var profilerRunning = false;

function toggleProfiling () {
  if (profilerRunning) {
	const profile = profiler.stopProfiling();
	console.log('>>>>stopped profiling at '+Date.now());
	profile.export()
	      .pipe(fs.createWriteStream('./v8-'+Date.now()+'.cpuprofile'))
	      .once('error',  profiler.deleteAllProfiles)
	      .once('finish', profiler.deleteAllProfiles);
	profilerRunning = false;
	return;
   }
   profiler.startProfiling();
   profilerRunning = true;
   console.log('>>>>>>started profilingat '+Date.now());
}

process.on('SIGUSR1', toggleProfiling);
How to capture CPU profiler dump in Linux App Service
- Login to your Node.js Linux App Service WEBSSH console.
https://<webapp-name>.scm.azurewebsites.net/webssh/host - Find your Node.js application process ID
# ps aux | grep node - Capture CPU profiler while running performance test on the website.
○ Start the CPU profiling by send the First -SIGUSR1 signal to the running Node process
○ Run test on the website
For example:
Accessing the https://<web-app-name>.azurewebsites.net/highCpuCall
○ Stop the CPU profiling by send the Second -SIGUSR1 signal to the same Node process
The v8 profiler will generate a v8-<timestamp>.cpuprofile file under /home/site/wwwroot folder.
How to use Google Chrome Developer tools to analyze the profiler file
- In you local machine, open your Google Chrome Browser.
Then use F12 to open Chrome Dev Tools.
Find and open "More tools" -> "JavaScript Profiler"
Load the v8-<timestamp>.cpuprofile file into it: - You can use "Heavy(Bottom Up)" view to check those .js files and functions that consumed most of the CPU time
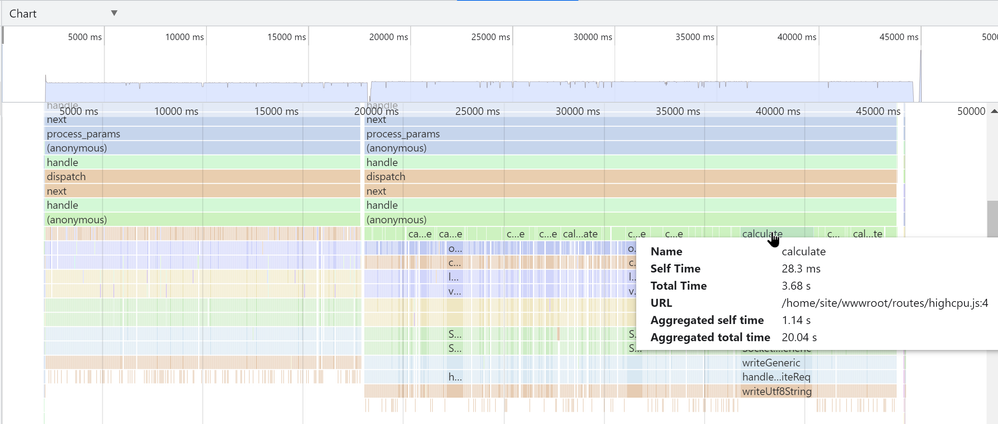
You can also use "Chart" view to find the function that consumed high CPU time.


