When running your Node.js application in Azure Linux App Service, you may encounter memory consumption issue.
Nodejs heapdump module provides developers a simple mechanism for producing V8 heap snapshots for later inspection. In this article, we will talk about:
- Instrumenting your app with heapdump
- Take Node.js memory heap dump in Linux App Service
- Use Google Chrome Developer tools to compare heap dump files, so we can efficiently locate memory leak issue in the Node.js application
Instrumenting your app with heapdump
- Install the "heapdump" module
In general, we just need to use npm to install the "heapdump" modulenpm install heapdumpFor your Node.js application going to deploy to Azure App Service, we can define it in your package.json "dependencies" section like the following:
- Once installed, you need to load the heapdump module into your application
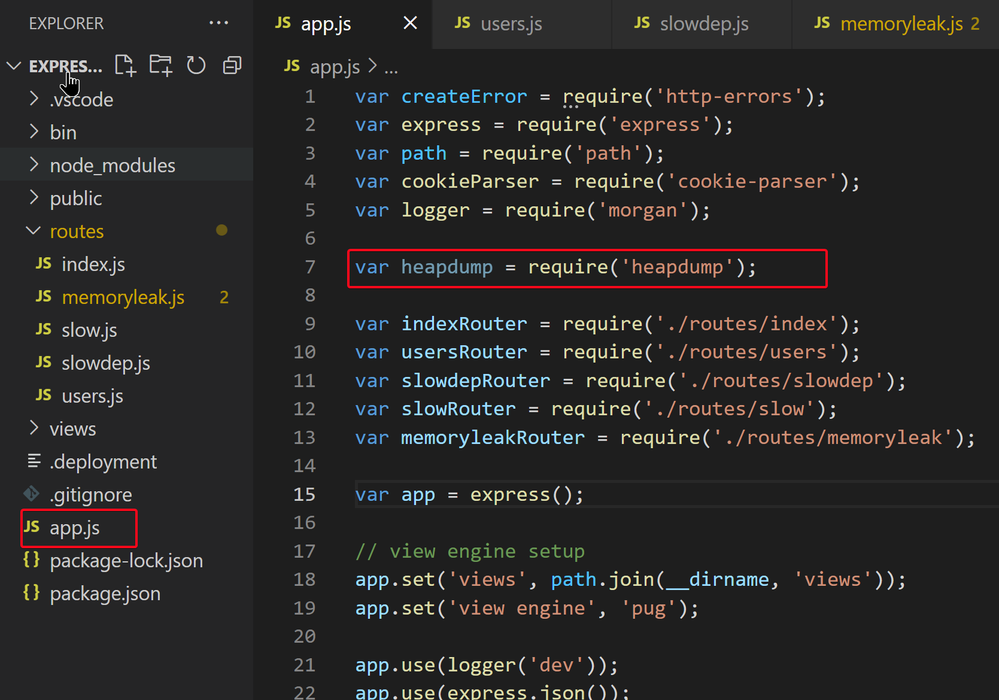
For example, in my Node Express project, I put the following line in my app.js file.var heapdump = require('heapdump')
If you are going to run this application in Linux OS (like Linux App Service), no other code change required for heap dump.
But if you need to run it in Windows OS, you will have to explicitly use the following code to take heap snapshot.heapdump.writeSnapshot()
Take Node.js memory heap dump in Linux App Service
After you deployed your Node.js Application with heapdump installed and loaded, you can startup and keep your Linux App Service run as normal.
When you need to investigate a memory leak issue, we can take multiple heap snapshots in a sequence of time.
- Login to your Node.js Linux App Service WEBSSH console.
https://.scm.azurewebsites.net/webssh/host - Find your Node.js application process ID
# ps aux | grep node - Take the first Snapshot as the base line.
We can use SIGUSR2 signal to trigger the heapdump module to capture a snapshot.
Use the following command to take a heap snapshot:# kill -SIGUSR2 <node_pid>
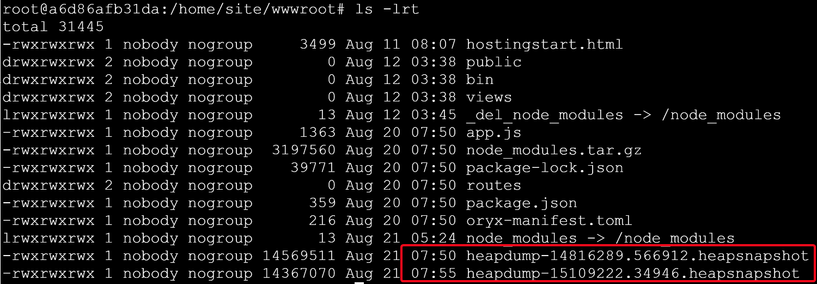
Snapshots are written to your node application working directory (/home/site/wwwroot) with a timestamp like heapdump-xxxxxxx.xxxxxx.heapsnapshot. - Run load test on you App Service for a while to let the memory usage grow. Then take the second Snapshot.
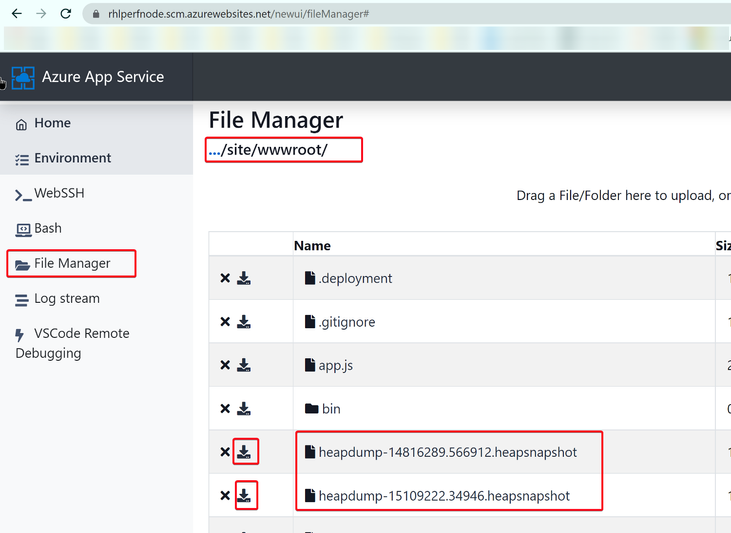
- Download your heap dump files to your local machine.
We can go to https://.scm.azurewebsites.net/newui/fileManager# to download the files
Use Google Chrome Developer tools to compare heap dump files
- In you local machine, open your Google Chrome Browser.
Then use F12 to open Chrome Dev Tools.
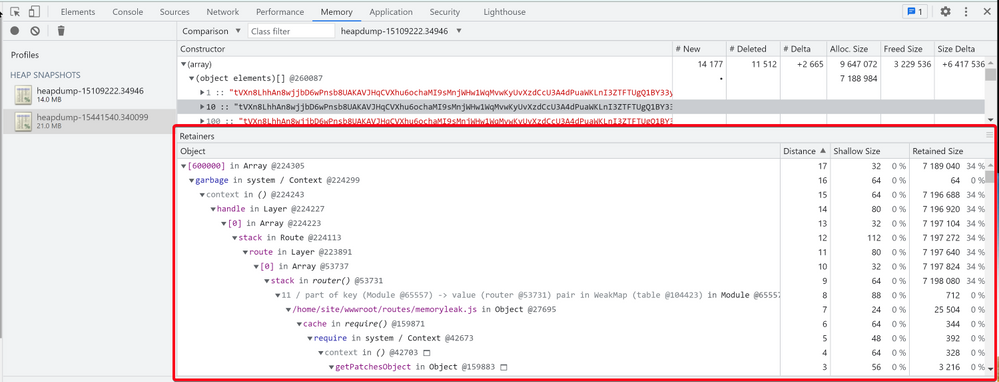
Load the heapdump-xxxxxxx.xxxxxx.heapsnapshot files into Chrome Dev Tools by going to the Memory tab, right-clicking the Profiles pane and selecting Load: - Select the second heapdump file (the one captured later), then use "Comparison" to compare it with the first heapdump file (the one captured earlier)
- We can sort the result by "#Delta" or "Size Delta" to see which type of object increased dramatically.
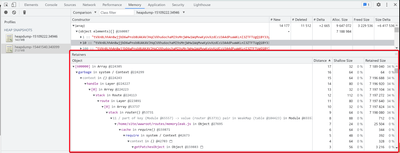
Then we can find those objects with highest Allocation Size.In the above example, we can see an Array consumed large amount of memory.
This is because of my example memory leak code keep on appending the Array with a random string "tVXn8LhhAn8….."var express = require('express'); var router = express.Router(); const numeral = require('numeral'); var garbage = ['g1']; function generategarbage() { for (let i = 0; i < 10000; i++) { garbage.push("tVXn8LhhAn8wjjbD6wPnsb8UAKAVJHqCVXhu6ochaMI9sMnjWHw1WqMvwKyUvXzdCcU3A4dPuaWKLnI3ZTFTUgQ1BY33yGSWxGRA0RfYmqgtPkZxqp2ErjG0Uzle2npbmFWIsQeP8XTLPL3phqusfisswxvZafAx6XsKmNrPeVjSPTgoFeoe9tOUlriRxRtTOSXgXOOcGO9aWlkrA2pFI9d71R9bgn3xlpgJ7zKUMyi4lHPY2MCQxKGFAyk7DiW3sklLn5ePLEYQI0Q8Cd345lXknjsITfLBbe0UFMlzXdvdPerZpCdtnKdo4opZFy7xQOnjxQICmgxRs5J45PiKMPxOCqb5s1OBhPid2gT2pQibMWpUL6W7xGMNt4oWXpnNhQASEAnIEOt6aKhLncnrHM12pyUAdhqVXzNVmh5q7hNmFbeOL6iEoUrewuKWOTIgNdWK13n98y5kIQ69Gsqa12GKtq2pQGaP4kRkkNdc4GkAU9X9QftfAkui31WjNoaiXFFjQOgwcy70ukPQB5m180HBQr5OiyGhCG9JSmP1wkFpZNEhUsCN7XlxWWYVkh3fdcPauzS2vZtVyBlC9qupcLzOSzQVcMaHkAHDB0oHVMoVSXAnZlTB1i1TRi01grHQrNuUEWSEW7mpqdq3cVzpoU0eYNs7kydb9qaIx2UhSjzLy3zjqcw6IC7e0nMfSAce2relcYORjiIjZcwh73fYDckEVaxzhn0L5CftTXyZaZX9OmsL9gJOtBxPW5GqQjgqlCoPhh4kh3eLC9W3ZN1cF69EXMAkh6Z6YN0rjDgf5eSWxazqFCL7fWWRAlJoZadFhgPlXa6AiGtP18SeBuvnPPgsIEdowhblHBSReVrcJJBeGIIPJpebS6MF89q8y3np05jzmkPJzx4bABhaoc9tyjxJIRLm67HDiqqJkCEx6rrlG3NtgdQkmwDFItkRHHyyppMVphiL9oXRvSdQUX2EQe03wQ8lSXzANiNxSUeq"); } } /* GET home page. */ router.get('/', function(req, res, next) { generategarbage(); res.status(200).send(`Array appended.`); }); module.exports = router; - By clicking on any of those objects, we can dig deeper to check the "Retainers" details.
It can help you figure out why the memory leak objects cannot be cleaned up by V8 GC, and trace back to the related piece of code.
Posted at https://sl.advdat.com/3tVovSL

