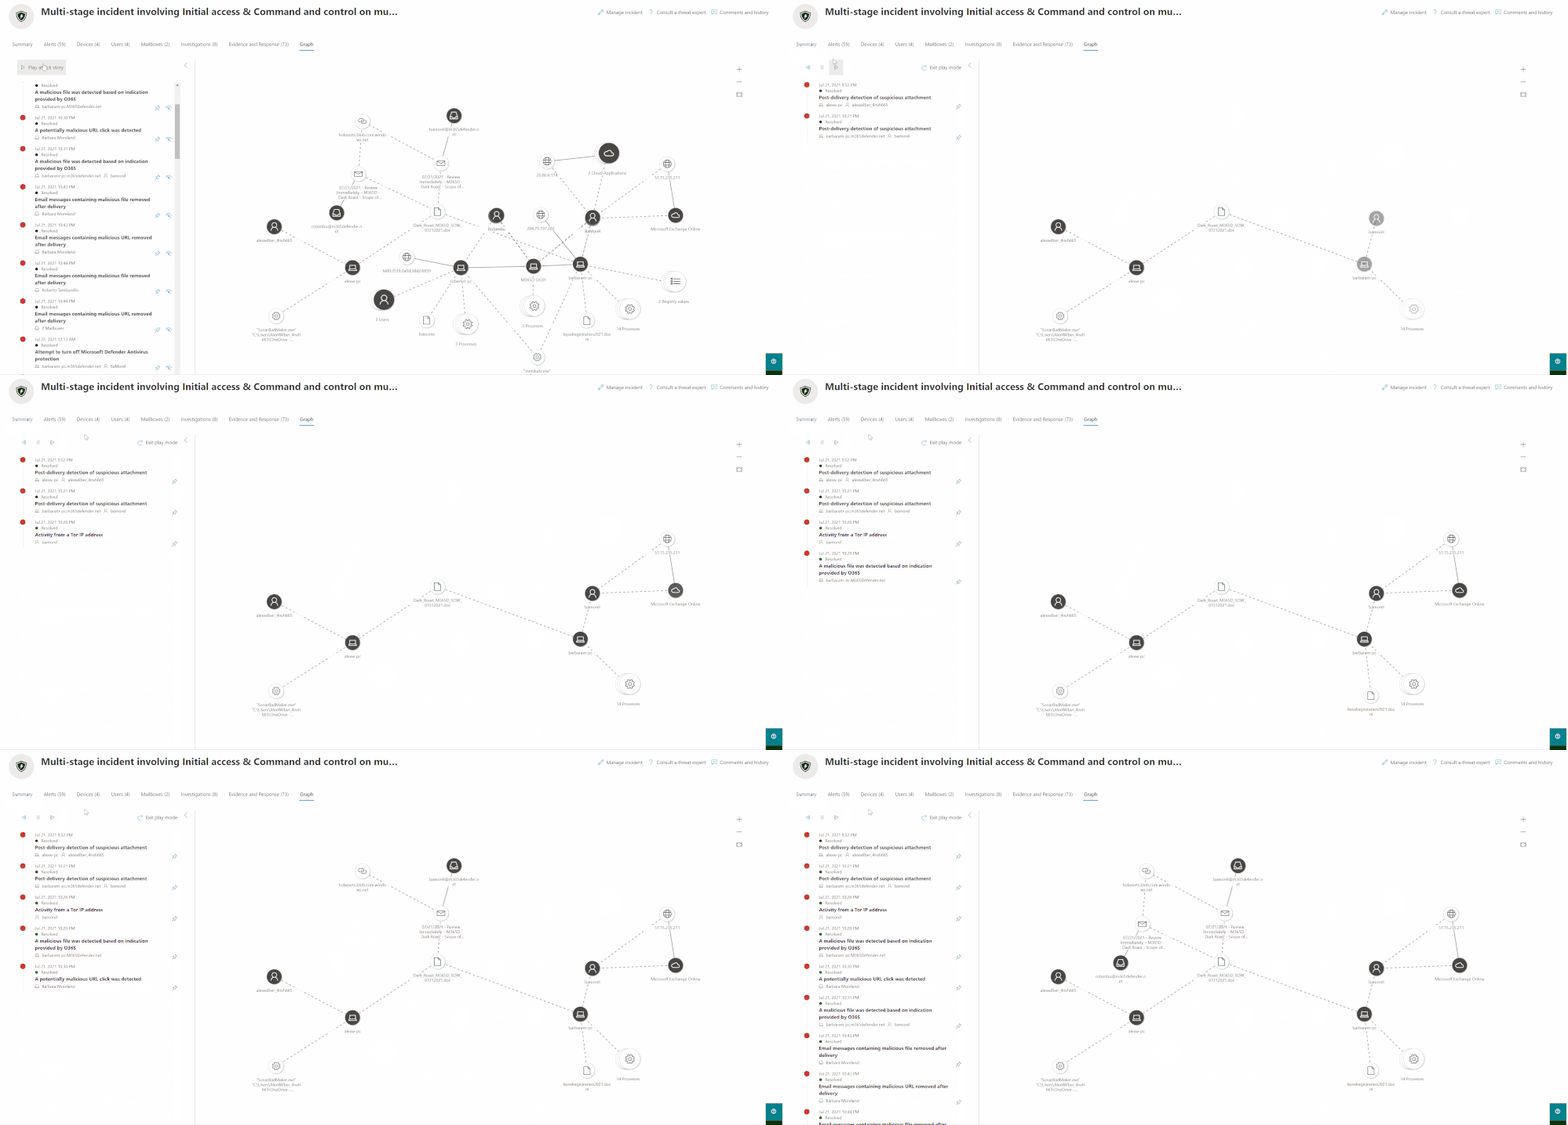
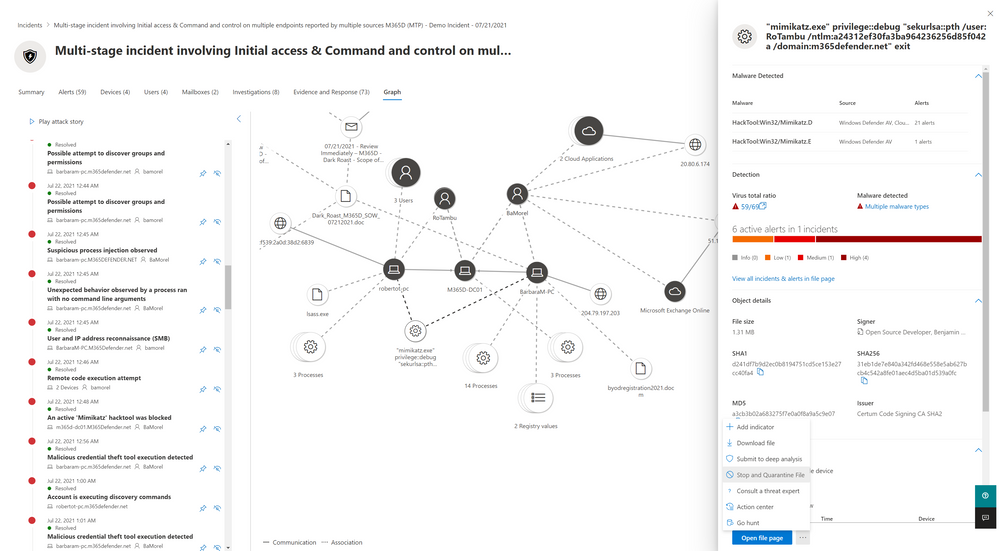
The new incident graph helps you quickly understand and visualize the full timeline and related entities of an attack by connecting the different suspicious entities with their related assets such as users, devices, mailboxes and applications. The graph presents a holistic view of how an attack spread through an environment over time, where it started and how far the attacker went.
Play the attack over time
Now you will be able to:
- See how the incident’s alerts are connected
With one glance you can see the connection of alerts to the impacted assets in your organization. - Pivot to alerts directly from the graph
You can view the alerts right from the graph page and quickly drill down to view more details. - Open the entity details directly from the graph
You can view the entities details without losing orientation directly from the graph and act on them with response options like file delete, device isolation, etc. - Highlight the entities related to an alert
Easily see which entities are related to which alerts and how they are part of the story of the attack.
To easily investigate the incident and to help get you oriented, you can select specific alerts for which you want to highlight relevant entities.
Highlight specific nodes on the graph based on the alert
You can drill down to each alert directly from the graph as well as open the entity side pane.
This will allow you to review the entity details and take remediation actions, such as deleting a file or isolating a device.
So now you can review, investigate and remediate attacks while seeing the full story of the attack right away and understand how the entites are connected to each other.
The incident graph in Microsoft 365 Defender is available from the new Graph tab of an incident .
See also
Posted at https://sl.advdat.com/2V8cnk6


