Azure Defender is an evolution of threat-detection technologies in Security Center protecting Azure, On-premises, and hybrid cloud environments. Security Alerts are the notifications that Security Center generates when it detects threats on your resources. Security Center prioritizes and lists the alerts, along with information needed for you to quickly investigate the problem. Security Center also provides detailed steps to help you remediate attacks. Alerts data is retained for 90 days. Here is the list of resource types that Azure Defender secures. Make sure to visit this article that lists the security alerts you might get from Azure Security Center and any Azure Defender plans you’ve enabled.
Azure Security Center allows you to create custom workbooks across your data, and also comes with built-in workbook templates to allow you to quickly gain insights across your data as soon as you connect a data source. For example, with Secure Score Over Time report, you can track your organization’s security posture. Read more about how workbooks provide rich set of functionalities in our Azure monitor documentation and to understand workbooks gallery in Azure Security Center, make sure to review our documentation.
With this blog, I’m introducing you to another great template that provides representation of your active alerts in different pivots that would help you understand the overall threats on your environment and prioritize between them.
Pre-requisite: Most of the workbook uses Azure Resource Graph to query the data. At some places (to display Map View) it uses Log Analytics workspace to query the data. So, make sure you have continuous export turned on and exporting the Security Alerts to the Log Analytics workspace as shown in the image (1) below.

To configure continuous export across your organization, use the supplied Azure Policy 'DeployIfNotExist' policies described in Configure continuous export at scale.
The Azure Defender Alerts workbook creates three pie charts and six graphs for the subscriptions as explained in detail below -
Pie Charts:
|
Pie-Chart |
Example |
|
Severity Use this section to monitor the number of active alert counts and its severity rank for your subscriptions.
This will help you to immediately understand the magnitude of the main threats on your environment. |

|
|
Resource Group Use this section to monitor the number of active alerts in each Resource Group.
This graph will help you remediate the active alerts very easily based on the Resource Group. |

|
|
Tag Use this section to monitor the count of active alerts per Tags.
This graph will help you remediate the active alerts very easily based on the tags. |

|
Graphs:
The workbook has several graphs displaying detailed information on the alerts as follows:
|
Graph |
Example |
|
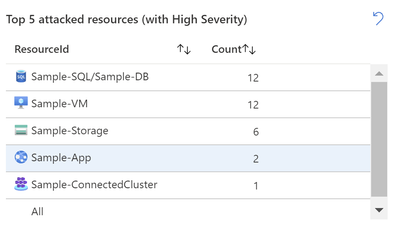
Top 5 attacked resources: This table will display Top five attacked resources with resource names and the count.
The table will further drill down to each alert providing you details like AlertDisplayName, Tactics, SeverityRank, SubscriptionId and more. (Refer to the GIF below for the output example)
ResourceId representing “All” in these three graphs, shows you all the attacked resources in your environment (regardless of their Severity).
|

|
|
Top Alert Types: This table will display a list of Top alerts in your environment with the alert display name and how many times an alert has appeared in your environment as shown in image (3). These details will give you a good understanding of the common alerts your environment has been experiencing in order to help you take proactive action.
|

|
|
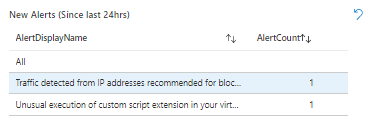
New Alerts: This table will display information if your environment has any new alerts since last 24hrs.
This information will help you react quickly to the immediate threats on your environment.
|

|
Example of alerts navigation:
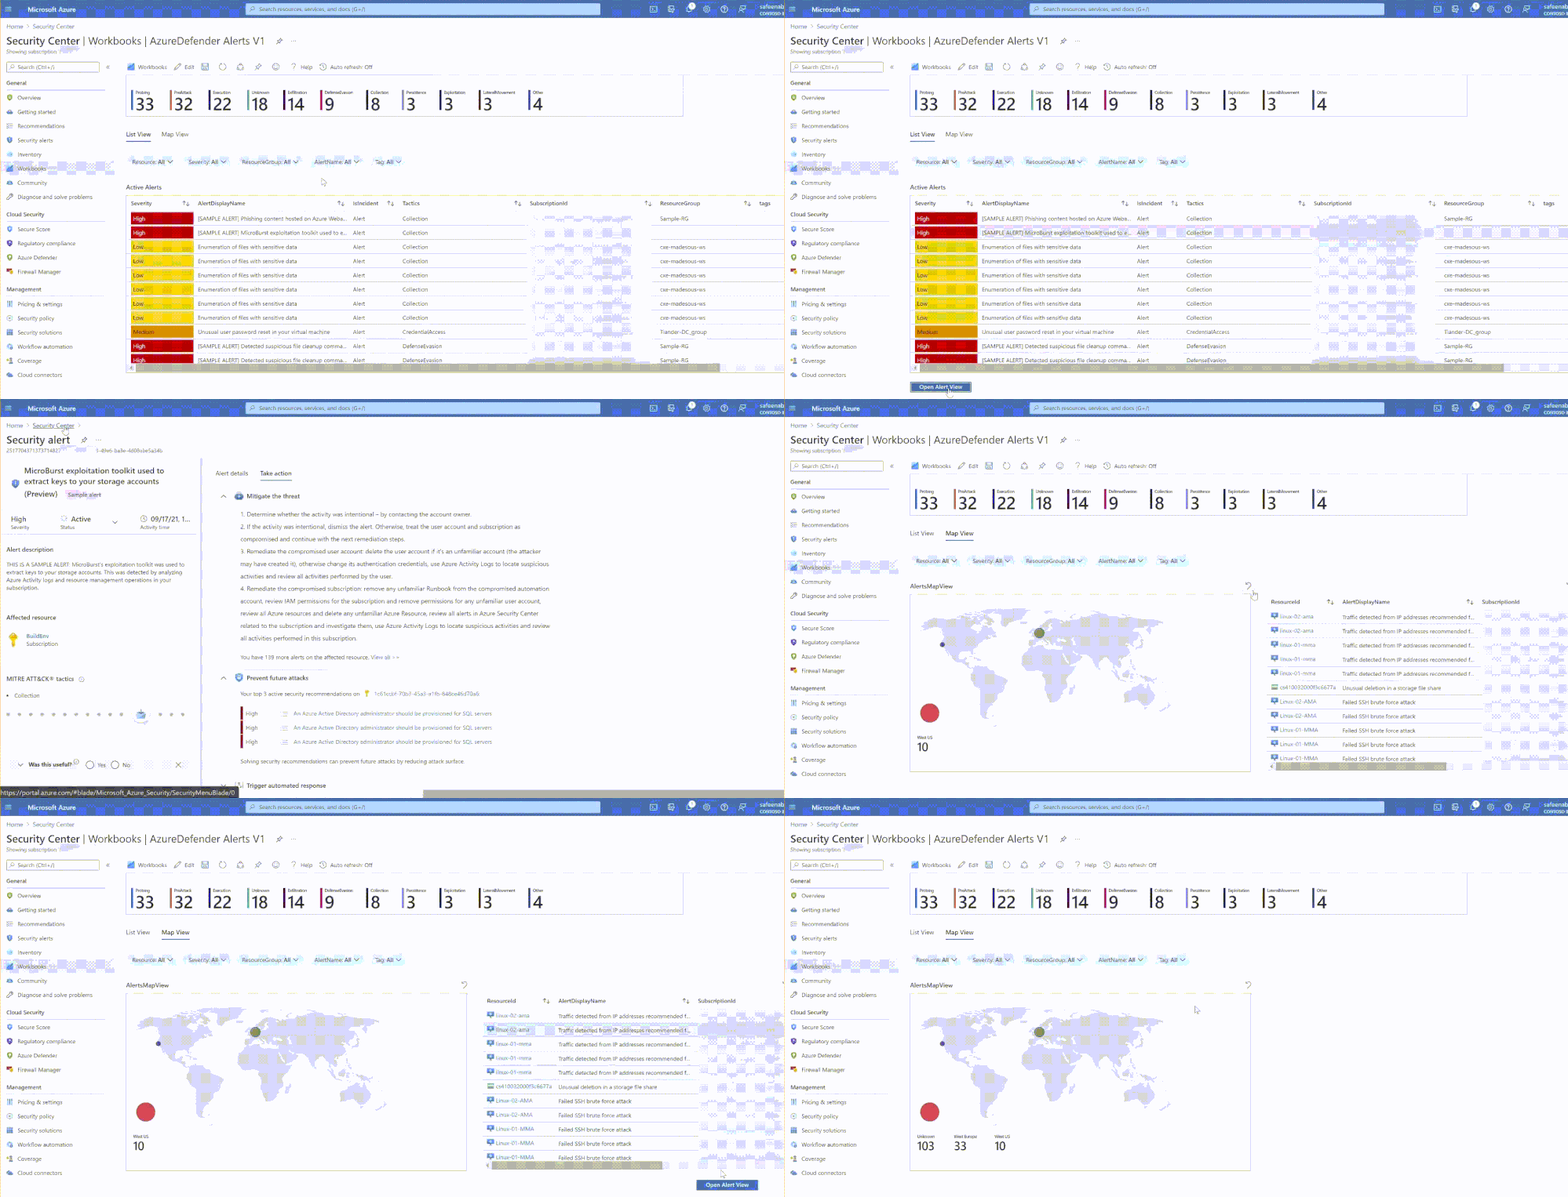
As you navigate through the alerts in the above graphs, you could dig through deep into the alert to understand the number of alerts raised for that resource. As you navigate through these three graphs to review the alerts, make sure you click on the ‘little arrow’ at the top of each table (that reads ‘clear selection’) to clear the current selection before you start clicking on the alerts from the second and third graphs.
Clicking on any alert you want to review in the graphs will present you ‘Open Alert View’ button at the bottom of the table clicking on which would open-up more details about the alert you selected.
Refer to the example below on alerts navigation.
MITRE ATT&CK tactics
The MITRE ATT&CK matrix contains a set of techniques used by adversaries to accomplish a specific objective. Those objectives are categorized as tactics in the ATT&CK Matrix. The objectives are presented linearly from the point of reconnaissance to the final goal of exfiltration or "impact". Within each tactic of the MITRE ATT&CK matrix there are adversary techniques, which describe the actual activity carried out by the adversary.
Azure Defender alerts presents the kill-chain stage of the detected suspicious activity based on MITRE ATT&CK matrix. Azure Defender monitors for many threats to resources and most alerts have MITRE ATT&CK tactics that can help you understand the kill chain intent. Security Center’s supported kill-chain intents are based on version 7 of the MITRE ATT&CK matrix.
In this section of the workbook, you’ll be presented with a graph representing the number of active alerts in each kill-chain stage. This graph will help you understand the kill-chain intent of an attack so that you investigate and report the event more easily and address the more urgent alerts (in advanced MITRE ATT&CK tactic) sooner.
List View &
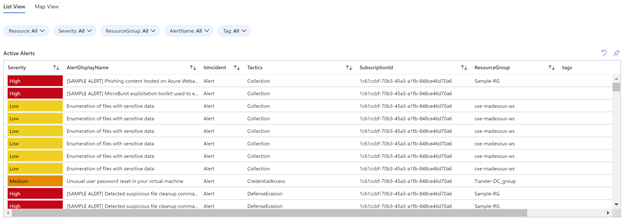
This section of the workbook will provide you details of all the current active alerts in your organization in two views (List View and Map View). Displays very important information that you should pay attention to. For eg., Severity, AlertDisplayName, If this is an Incident (Azure Defender provides a correlated view called Incidents) or an alert etc. Use this data to analyze what actions the attacker took, and what resources were affected. Have strategies to react to alerts as soon as they are generated.
Use the data to support these activities:
- Remediation of threats.
- Investigation of an incident.
- Proactive hunting activities.
Under List View, clicking on any alert you want to review will present you ‘Open Alert View’ button at the bottom of the table which would open-up more details about the alert you selected.
The workbook also presents you with Map View, this map represents security alerts that contain IP addresses targetting your resources. Markings on the map represent sources of the attack on your resources.
Inorder to review the alert, you can click on the dot in the AlertsMapView table, which will present another table with the affected ResourceId, AlertDisplayName, SubscriptionId, StartTime and Resource Group that’s under attack.
You can further drill down to the details of the specific alert you wish to, by selecting the alert which will present a button at the bottom of the graph ‘Open Alert View’, clicking on which would take you to the details of the alert.
To select another dot and view details of that alert, you might have to clear selection by clicking on the ‘arrow’ (that reads ‘clear selection’) at the top of the map graph.
Check out the below that gives you an overview of the usage of these fields.
Make sure to refer to this article to understand list of security alerts you might get from Azure Security Center and any Azure Defender plans you’ve enabled.
Make sure to utilize the additional filters we have in the workbook, to search for the alerts for eg., with just high/low/medium severity etc.
You can find this workbook in our Github repository
Direct link to the Azure Defender Active Alerts workbook
Hope you had fun deploying and navigating through the workbook to get an end-to-end experience on the alerts. Do let us know your feedback.
Acknowledgements:
Special thanks to @Lihie_Berkovitz, for the partnership throughout the build phase, for reviewing the blog and for providing valuable inputs
Thanks to @tal_rosler (Tal Rosler) for reviewing the blog.
Posted at https://sl.advdat.com/2YKkqVG


