Azure Security Center will leverage the Log Analytics agent to scan operating systems for misconfiguration, or to gather evidence for malicious behavior, so security alerts can be created. It will show the “Log Analytics agent should be installed on ... " recommendation in case there is a server that does not have the agent installed, but there won’t be a warning in case an agent stopped reporting to its Log Analytics workspace. In addition to that, you will see the “Azure Defender for Servers should be enabled” recommendation in case you have not switched the plan on.
While, from a CSPM (=Cloud Security Posture Management) perspective, it makes sense to only show the agent installation status ( because agent monitoring is part of operations, not of environment hardening), SOC teams have asked for a capability to easily see machines that are “securely monitored” if three conditions are met:
- the machine is protected by Azure Defender for Servers, which means that the plan has been enabled on the machine’s subscription
- the Log Analytics agent has been installed and is connected to a workspace which has Azure Defender for Servers enabled
- the agent is properly reporting
Today, I’m happy to announce that we’ve built another custom workbook that allows you to easily see your machines’ protection status, no matter if they are Azure VMs, or machines which are connected through Azure Arc.
Overview
The workbook provides different layers of information, spread across different tabs. It depends on data coming from both, Azure Resource Graph, and the Log Analytics workspace(s) your machines are connected to. Therefore, the dashboard comes with a workspace selection drop down which allows you to select one, several, or all workspaces in your environment.

After selecting one, several, or all workspaces in your environment, the overview section of the workbook will appear. This section contains three pie charts that help you grasp an overview of your machine's current status:

|
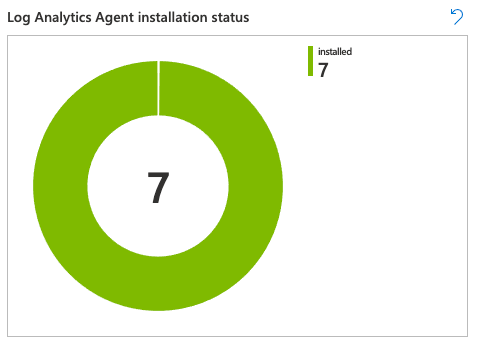
The Log Analytics Agent installation status chart on the left is a representation of each machines’ installation status, as reported by Azure Security Center. It gives you an easy overview of all machines covered by Security Center, sorted by agent installation status. |
 |
The Log Analytics Agent reporting status chart in the middle shows the current reporting status for all machines. Currently reporting means that a machine has been sending information to its workspace within the last 15 minutes. The other shades will show machines that have not been reporting since
|
 |
The Azure Defender coverage chart on the right is a representation of each machines’ protection status, as reported by Azure Security Center. It gives you an easy overview of all machines covered or not covered by Azure Defender for Servers. |
Whenever you click a pie chart, a detailed table is shown underneath, giving you the detailed representation for the value you selected in the chart. Figure 5 shows the table that’s created when selecting machines that have not been reporting for more than 48 hours.
 Figure 5 - Log Analytics agent reporting status details
Machines not reporting to LA workspace
The second tab shows a detailed view of all machines that have not been reporting for some time. This data is sorted into different tables, making it easier to determine which machines to focus on first.

The four tables show machines that are currently not reporting, only. They are sorted by the time they have been reporting last:
- machines, that are not reporting for more than 15 minutes
- machines, that are not reporting for more than 24 hours,
- machines, that are not reporting for more than 48 hours,
- machines, that are not reporting for more than 7 days.
These tables will only consider machines that have not been reporting up to 30 days.
Security status
The third and last tab is an overview of all machines that are covered by Azure Security Center, including Log Analytics agent installation and Azure Defender coverage status, plus the number of open recommendations per machine, as reported in the Security Center inventory.

You can find this custom workbook in the Azure Security Center Github repository, or you can directly deploy it to your environment by clicking this link.
Posted at https://sl.advdat.com/3AXTVtj