ADX Insight's "Cache" tab allows you to monitor and analyze your actual cache usage.
In this tab, you will find a list of your cluster's tables. For each table, you will see data about the hot cache size, the current cache policy, the total number of queries on this table, and the actual queries lookback period in days (95th percentile). For more information about what a cache policy is, see this document.
The ADX Insights blade is located in the Azure portal > Your cluster page > "Insights" blade ().

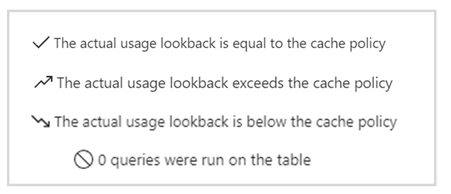
For each table, you will see an indication of the actual usage lookback compared to the defined cache policy of the table.
This way, you can quickly identify tables with excessively low or excessively high cache policies, compared to the actual queries lookback (in other words, the time filter patterns of your queries, or, how you use time filters in the queries). Adapting the cache policy, per table, to usage patterns can improve performance and reduce costs.
It also highlights tables with no queries, so you might want to consider deleting these tables (if the data is not needed) or reducing their cache policy.
Clicking on the row of each table will display the usage histogram.
This histogram shows the number of queries (y-axis) for each query lookback in days (x-axis). This way, you can visualize how users use the query's time filters. It also shows whether the lookback was in-cache (blue bars) or out-of-cache (orange bars).
Below the histogram, you will find a tabular representation of the histogram's data. For each lookback period, it shows the percentage of queries looking back to that period, as well as the aggregated percentage of queries using that lookback. Using this method, you can choose the cache policy that will cover the desired percentage of your queries.
Clicking on a lookback period record will bring up a separate grid containing the user details who used that selected lookback period.
This grid shows the details of the user, the application, and the number of queries. This grid may be useful for detecting unexpected outliers (for example, users who run queries with a long lookback period, or queries without time filters, beyond the defined cache policy).
Also, you may receive specific recommendations regarding your cache policy from Azure Advisor.
The Azure Advisor recommendations for ADX are limited in scope. For instance, Advisor recommendations may be generated if there have been enough queries in the past 30 days to analyze. Furthermore, the Advisor's cost recommendations are provided only if the cluster can be scaled-up or scaled-down after a cache policy change.
The cache tab in Insights provides a complementary exploration experience, showing you the raw usage data per table.
