Today, we're excited to announce that Azure Resource Manager metrics are available in Azure Monitor.
When you create and manage resources in Azure, requests are orchestrated through Azure's control plane, Azure Resource Manager. With the metrics we've announced today, you now have observability into the traffic and latency for control plane requests made throughout your subscriptions. For example, you can now figure out when your requests have been throttled or have failed by filtering for specific status codes. This data and the rich dimensions we expose, like Method, ResourceType, and StatusCode, will enable you to dig deep into how your requests perform in Azure!
The Azure Resource Manager metrics cover the past three months (93 days) of requests and currently track synchronous requests. For a scenario like a VM creation, the metrics that you retrieve do not represent the performance or reliability of the long running asynchronous operation, but rather the initial PUT request and the subsequent GET requests.
You can access control plane metrics via the Azure Monitor REST APIs, SDKs, and the Azure portal. For an overview on Azure Monitor, see Azure Monitor Metrics. For guidance on how to retrieve a bearer token and make requests to Azure, see Azure REST API reference.
The metric namespace for the Azure Resource Manager metrics is "microsoft.resources/subscriptions" as you'll see in the example REST API request below:
curl --location --request GET "https://management.azure.com/subscriptions/00000000-0000-0000-0000-000000000000/providers/microsoft.insights/metrics?api-version=2021-05-01&interval=P1D&metricnames=Latency&metricnamespace=microsoft.resources/subscriptions®ion=global&aggregation=average,count×pan=2021-11-01T00:00:00Z/2021-11-03T00:00:00Z" \
--header "Authorization: bearer {{bearerToken}}"
For using this in Azure portal, you will first need to navigate to the Azure Monitor blade within the portal:

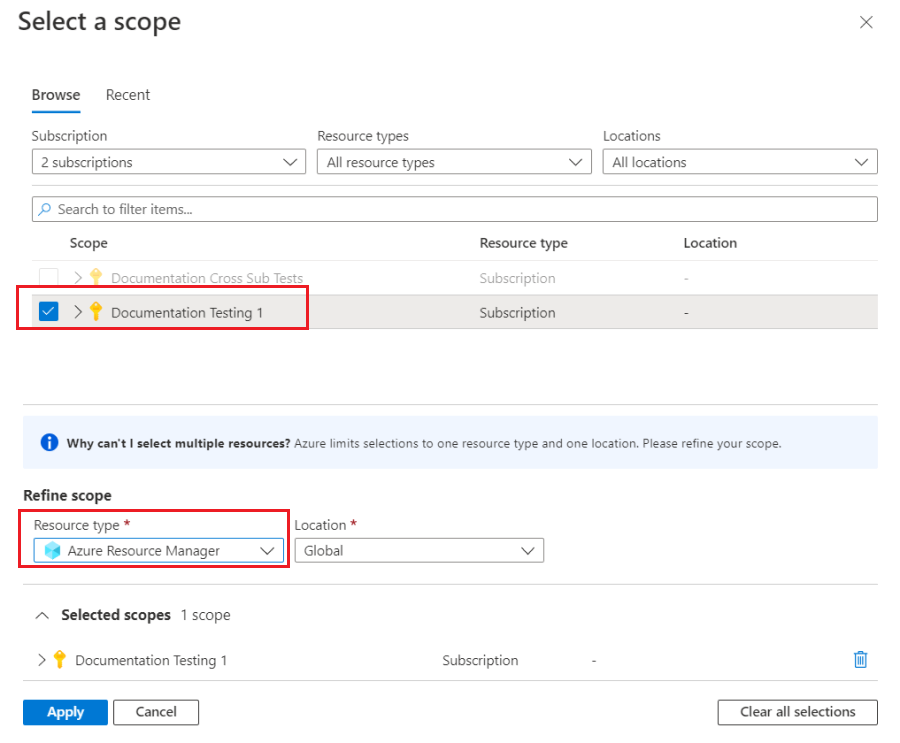
After selecting Explore Metrics, select a single subscription and then select the Azure Resource Manager metric:

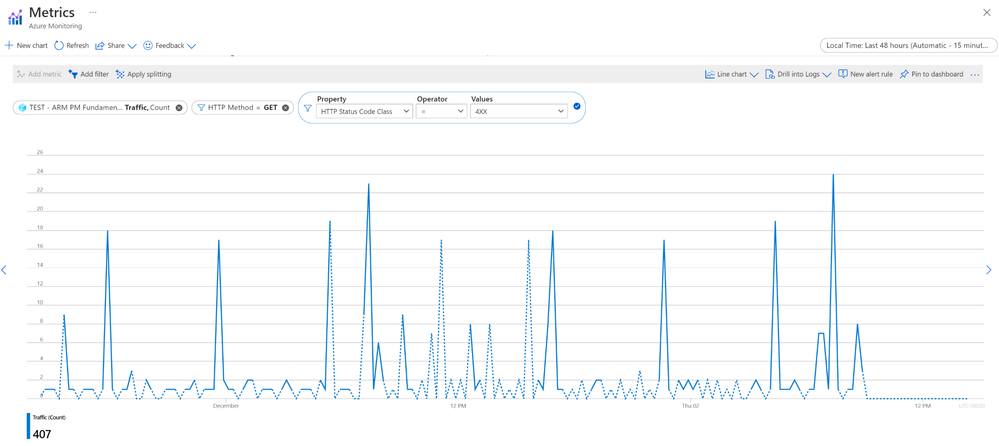
Then, after selecting Apply, you can visualize your Traffic or Latency control plane metrics with custom filtering and splitting:

For more details on filtering and scoping dimensions and specific scenarios like examining your throttling requests, see Control plane metrics in Azure Monitor - Azure Resource Manager | Microsoft Docs.
We've built and enabled these metrics so you have more observability into your own request patterns and into Azure's commitment to operational excellence! We hope that you enjoy this capability and make full use of it for your scenarios ranging from viewing monthly traffic to pulling detailed hourly 4xx and 5xx status metrics.
Posted at https://sl.advdat.com/3ysoTu1