Are you concerned about connection failures? Are you interested in connection patterns, connection health or connection drilled down?
Getting this information can be challenging. This blog describes how to create a dashboard for monitoring purposes having all the information in a single place. To make the process easy you can quickly deploy the dashboard using an ARM template or manually create it for higher customization.
All the information is retrieved using Azure Monitor Logs to query the server logs. In chapter Collections of Kusto Queries Language (KQL) for monitoring connectivity you can walk through all Kusto Queries used to get more insights on the connectivity for Azure Database for PostgreSQL Single Server.
Since a dashboard needs to be created for each PostgreSQL Single Server in chapter Create a Dashboard for monitoring connectivity using ARM Template you can understand how to automate the deployment process of the dashboard using the provided ARM template. Deploying the dashboard using the ARM template is quick and it will take less then 2 minutes!
In the last chapter you can learn how to manually create the dashboard that incorporates all Kusto Queries. That will give you the option to customize the dashboard based on your needs.
Prerequisites needed for this tutorial
-
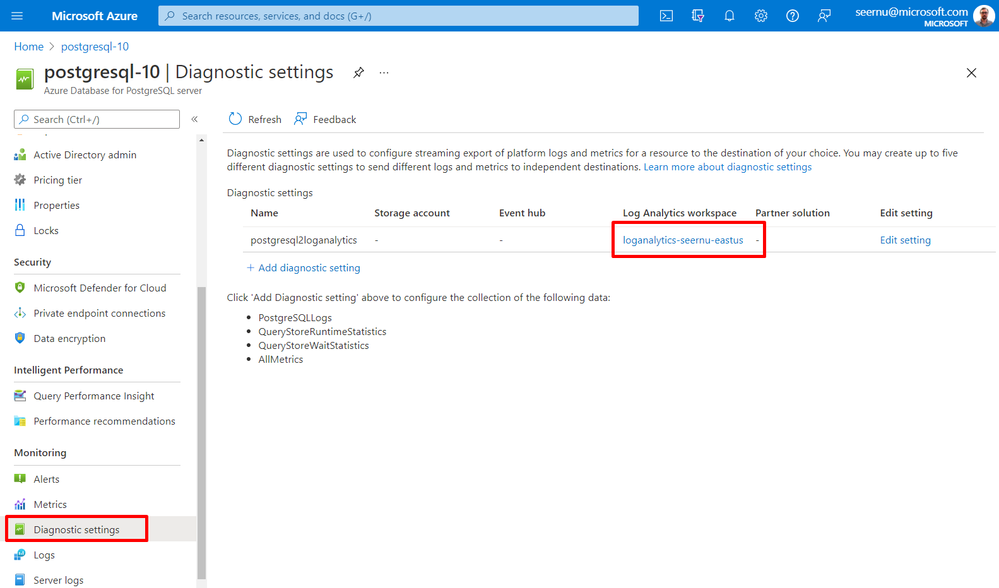
Configure Azure Diagnostic to send PostgreSQL server logs to Azure Monitor. For more details see how to set Azure Monitor diagnostic settings in Azure Database for PostgreSQL Single Server.
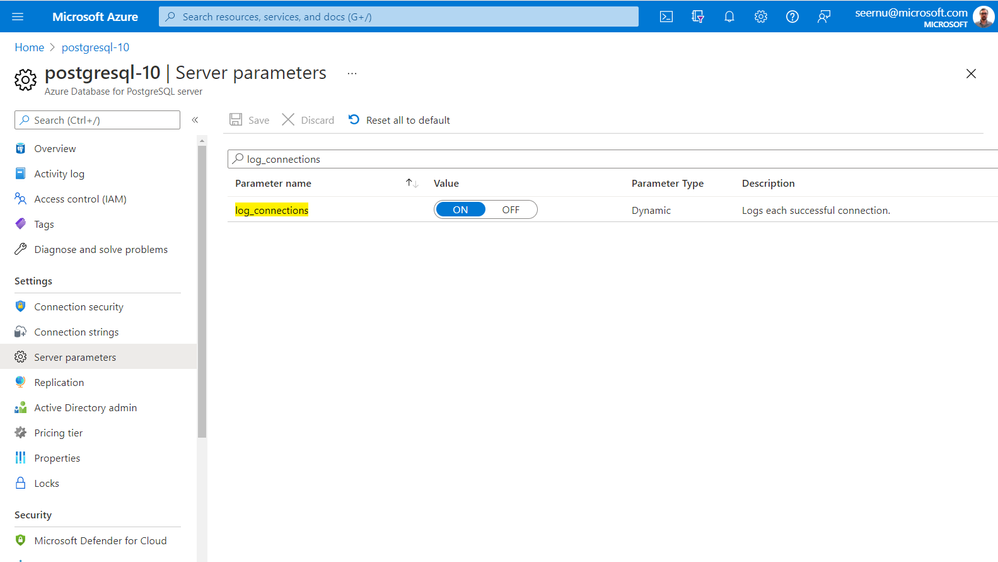
- Make sure server parameter log_connections=ON (which is the default value in Azure).
Create a Dashboard for monitoring connectivity using ARM Template
Because a dashboard must be created for each Azure Database for PostgreSQL Single Server, I have created an ARM template that can be used to easily deploy the dashboard by specifying just the PostgreSQL Resource URI and the desired Dashboard Name.
Following below steps you can walk through how to deploy the dashboard using the provided ARM template in the Azure Portal, nevertheless the template can be used as well with azure-cli or PowerShell.
If you jumped straight away to this chapter, please make sure you have followed the prerequisites described in previous chapter Prerequisites needed for this tutorial.
After downloading the ARM template ConnectivityDashboardPostgresqlSingleServerTemplate.json follow the steps:
-
Get the resource URI of the Azure Database for Single Server for which the dashboard is intended to be created.
-
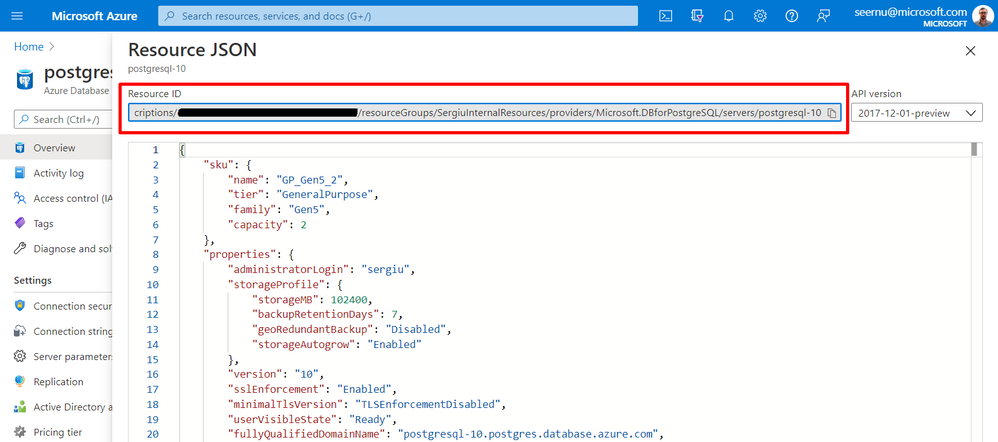
From the PostgreSQL server blade in Azure portal click on JSON view.
-
Copy the Resource ID as shown below
-
-
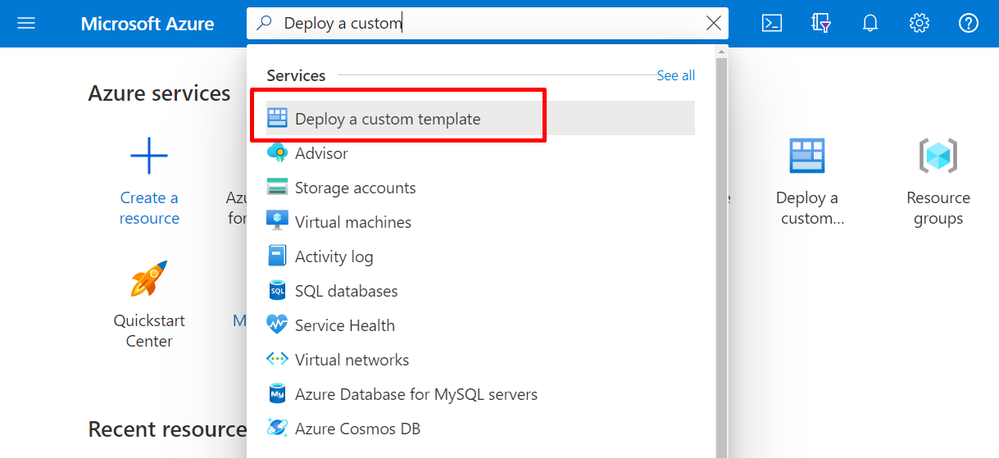
From the Azure Portal search and click on "Deploy a custom template"
-
Click on “Build your own template in the editor”
-
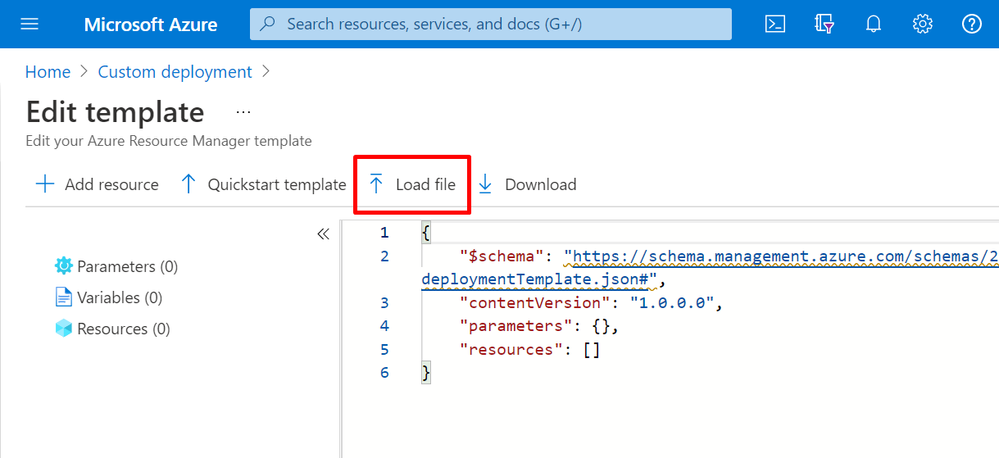
Click the “Load File” and choose the previous downloaded ARM template ConnectivityDashboardPostgresqlSingleServerTemplate.json. Once the content was uploaded press the “Save” button from the left bottom side of the screen.
-
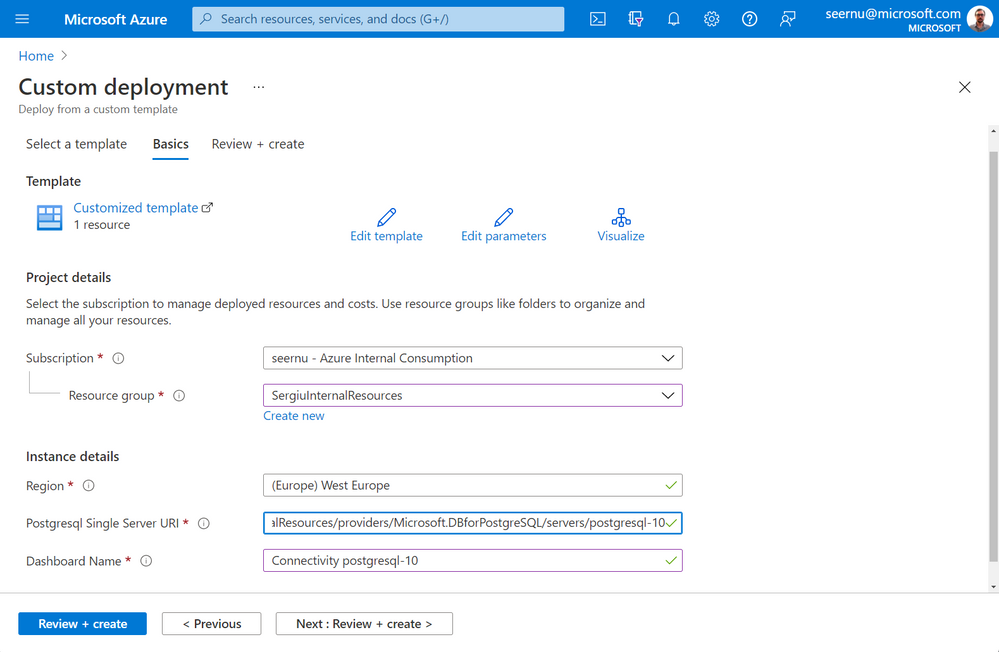
Complete required fields as indicated below. Afterwards press “Review + create” button.
- Choose Resource Group where the dashboard will be deployed
- Provide the “Postgresql Single Server URI” using the Resource ID retrieved in step 1 from this tutorial.
- Enter “Dashboard Name”. Note that the name is restricted to only alphanumeric and hyphen characters. The ARM template will automatically replace spaces with hyphens.
-
After validation passed press on “Create” button.
-
After the deployment is complete press “Go to resource”. From the resource press on “Go to dashboard” link to view the newly deployed dashboard.
Collections of Kusto Queries Language (KQL) for monitoring connectivity
In this section you will find a collection of 10 Kusto queries that will help monitoring and understanding connectivity pattern for your Azure Database for PostgreSQL Single Server. You can use any of the queries as a standalone one or incorporate in a dashboard, a process described in following chapter. The idea is to search and parse server logs to extract the needed information.
Most of the queries are designed in a way to be generated as a graph and to maintain a consistent picture across the selected time range. That being said, I have used the make-series function with 1 minute step to generate the data, where missing points (no data recorded in that particular minute) will be populated with zero values. As make-series function requires a start and end time these values are always computed in each Kusto Query to be able to integrate with Azure time range selector in the UI.
-
Connections by IP
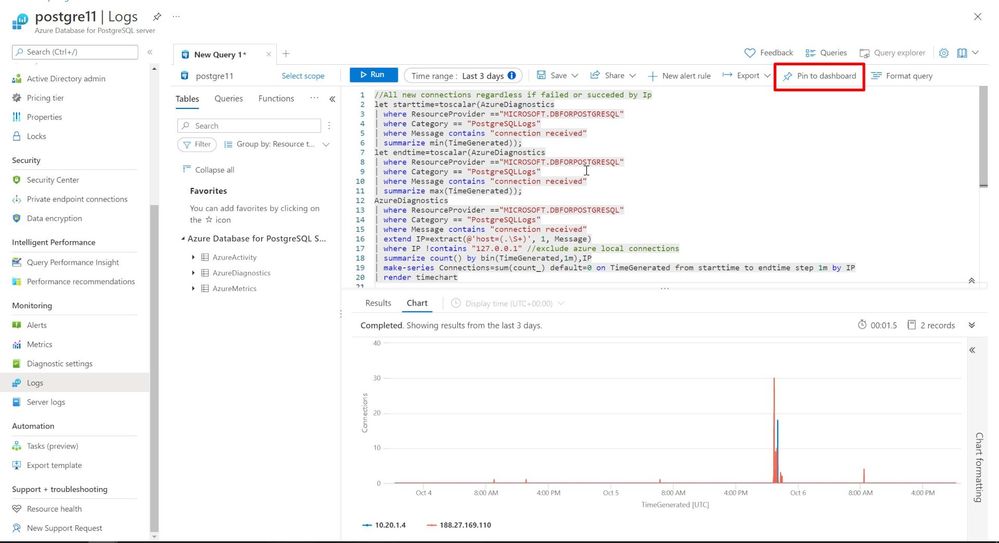
Below Kusto Query searches for "connection received" messages that denotes an incoming connection. Afterwards each log message is parsed using regular expression to extract the IP. Azure connections from IP 127.0.0.1 are excluded and the data is aggregated on 1 minute interval. The result set will include all connections regardless of the fact that were successful or failed.
//All new connections (including replication) regardless of failed or successful by Ip let AllConnections=AzureDiagnostics | where ResourceProvider =="MICROSOFT.DBFORPOSTGRESQL" | where Category == "PostgreSQLLogs" | where Message contains "connection received"; let starttime=toscalar( AllConnections | summarize mintime=min(TimeGenerated) | project bin(mintime,1m)); let endtime=toscalar(AllConnections | summarize max(TimeGenerated)); AllConnections | extend IP=extract(@'host=(.\S+)', 1, Message) | where IP !contains "127.0.0.1" //exclude azure local connections | summarize count() by bin(TimeGenerated,1m),IP | make-series Connections=sum(count_) default=0 on TimeGenerated from starttime to endtime step 1m by IP | render timechart -
Failed vs Successful Logins
In following Kusto Query I made a union between FATAL messages related to connectivity and successful connections denoted by "connection authorized" message. Successful logins will include both replication and non-replication connections and will represent an accurate picture. Some login failures on the other hand are not being recorded in server logs, hence failed logins are very close to the real situation, but not all failures will be caught by this Kusto query. As an example, connection failures due to connecting without SSL when SSL is required is not being recorded in the server log, therefore we cannot catch below login failure reported on app side.
psql: error: FATAL: SSL connection is required. Please specify SSL options and retry.
//Failed vs Successful Connections [including replication] let SuccessConn=AzureDiagnostics | where ResourceProvider =="MICROSOFT.DBFORPOSTGRESQL" | where Category == "PostgreSQLLogs" | where Message contains "connection authorized"; let FailedConn=AzureDiagnostics | where ResourceProvider =="MICROSOFT.DBFORPOSTGRESQL" | where Category == "PostgreSQLLogs" | where errorLevel_s =='FATAL' | where Message matches regex "role.*does not exist" or Message matches regex "database.*does not exist" or Message contains "no pg_hba.conf" or Message contains "password authentication failed"; let AllConnections=SuccessConn | union FailedConn; let starttime=toscalar( AllConnections | summarize mintime=min(TimeGenerated) | project bin(mintime,1m)); let endtime=toscalar(AllConnections | summarize max(TimeGenerated)); AllConnections | extend allmatches=extract_all(@'user=(.+)database=(.\S+)', Message) | extend user=tostring(allmatches[0][0]) | where user !contains 'azure_superuser' // exclude azure connections from successful connections. User (role) is not reported on failed ones | extend Connection=iff(errorLevel_s !contains "FATAL","SuccessfulConnection","FailedConnection") | summarize count() by bin(TimeGenerated,1m),Connection | make-series Connections=sum(count_) default=0 on TimeGenerated from starttime to endtime step 1m by Connection | render timechart -
Replication vs Non-replication logins
To distinguish between logins for replication purpose (either asynchronous read-replicas connections managed by Azure or logical replication) and regular connection you can use below Kusto Query. Replication connections are denoted by the message “replication connection authorized”, whereas regular connections by "connection authorized". From regular connections I have excluded azure internal connections denoted by user azure_superuser.
// Replication vs Non-Replication connections let AllConnections=AzureDiagnostics | where ResourceProvider =="MICROSOFT.DBFORPOSTGRESQL" | where Category == "PostgreSQLLogs" | where Message contains "connection authorized"; let starttime=toscalar( AllConnections | summarize mintime=min(TimeGenerated) | project bin(mintime,1m)); let endtime=toscalar(AllConnections | summarize max(TimeGenerated)); AllConnections | extend allmatches=extract_all(@'user=(.+)database=(.\S+)', Message) | extend user=tostring(allmatches[0][0]) | where user !contains 'azure_superuser' // exclude azure connections from successful connections. User (role) is not reported on failed ones | extend Connection=iff(Message contains "replication connection authorized","ReplicationConnection","Non-ReplicationConnection") | summarize count() by bin(TimeGenerated,1m),Connection | make-series Connections=sum(count_) default=0 on TimeGenerated from starttime to endtime step 1m by Connection | render timechart -
Successful logins grouped by database
The purpose of below Kusto Query is to understand the login pattern per database. Azure internal connections created by user azure_superuser are excluded. Because replication connections are not reporting the database they were excluded as well.
// Successful Non-replication connections by database let SuccessConnNonReplication=AzureDiagnostics | where ResourceProvider =="MICROSOFT.DBFORPOSTGRESQL" | where Category == "PostgreSQLLogs" | where Message contains "connection authorized" | where Message !contains "replication connection authorized"; let starttime=toscalar( SuccessConnNonReplication | summarize mintime=min(TimeGenerated) | project bin(mintime,1m)); let endtime=toscalar(SuccessConnNonReplication | summarize max(TimeGenerated)); SuccessConnNonReplication | extend allmatches=extract_all(@'user=(.+)database=(.\S+)', Message) | extend user=tostring(allmatches[0][0]) | extend database=tostring(allmatches[0][1]) | where user !contains 'azure_superuser' // exclude azure connections | summarize count() by bin(TimeGenerated,1m),database | make-series Connections=sum(count_) default=0 on TimeGenerated from starttime to endtime step 1m by database | render timechart -
Successful logins grouped by user
Following Kusto Query will show the login pattern per database user. Using this query you will be able to see the login rate by user for each 1 minute interval. Similar with previous one, Azure internal connections and replication connections are not taken into account.
// Successful Non-replication connections by user let SuccessConnNonReplication=AzureDiagnostics | where ResourceProvider =="MICROSOFT.DBFORPOSTGRESQL" | where Category == "PostgreSQLLogs" | where Message contains "connection authorized" | where Message !contains "replication connection authorized"; let starttime=toscalar( SuccessConnNonReplication | summarize mintime=min(TimeGenerated) | project bin(mintime,1m)); let endtime=toscalar(SuccessConnNonReplication | summarize max(TimeGenerated)); SuccessConnNonReplication | extend allmatches=extract_all(@'user=(.+)database=(.\S+)', Message) | extend user=tostring(allmatches[0][0]) | extend database=tostring(allmatches[0][1]) | where user !contains 'azure_superuser' // exclude azure connections | summarize count() by bin(TimeGenerated,1m),user | make-series Connections=sum(count_) default=0 on TimeGenerated from starttime to endtime step 1m by user | render timechart -
Replication logins grouped by user
Below Kusto query will extract the user from a replication connection. It might be extremely useful to understand when logical decoding consumers (subscribers) are connecting to the database server.
// Replication Connections by user let SuccessConn=AzureDiagnostics | where ResourceProvider =="MICROSOFT.DBFORPOSTGRESQL" | where Category == "PostgreSQLLogs" | where Message contains "connection authorized"; let starttime=toscalar( SuccessConn | summarize mintime=min(TimeGenerated) | project bin(mintime,1m)); let endtime=toscalar(SuccessConn | summarize max(TimeGenerated)); SuccessConn | where Message contains "replication connection authorized" | extend tmpuser=extract(@'user=(.\S+)', 1, Message) | extend tmpuser2=extract(@'(.+)SSL$',1,tmpuser) | extend user=iff(isempty(tmpuser2),tmpuser,tmpuser2) | summarize count() by bin(TimeGenerated,1m),user | make-series Connections=sum(count_) default=0 on TimeGenerated from starttime to endtime step 1m by user | render timechart -
Summary of Connectivity errors
Following Kusto Query will create a summary for all connectivity errors for the time range selector in Azure UI and will indicate the total number of errors and the time window they have encountered.
//Summary of Connectivity Errors AzureDiagnostics | where ResourceProvider =="MICROSOFT.DBFORPOSTGRESQL" | where Category == "PostgreSQLLogs" | where errorLevel_s =='FATAL' | where Message matches regex "role.*does not exist" or Message matches regex "database.*does not exist" or Message contains "no pg_hba.conf" or Message contains "password authentication failed" | project TimeGenerated, prefix_s,errorLevel_s, Message | summarize FirstError=min(TimeGenerated),LastError=max(TimeGenerated), Counter=count() by ErrorMessage=Message | order by Counter desc -
Summary of New Connections by IP
Below Kusto Query will summarize all new connections by IP based on the selected time range in Azure UI. Azure internal connections from 127.0.0.1 are excluded. An important mention is that it will not be distinguished between failed or successful connection.
//Summary of all new connections by IP AzureDiagnostics | where ResourceProvider =="MICROSOFT.DBFORPOSTGRESQL" | where Category == "PostgreSQLLogs" | where Message contains "connection received" | extend IP=extract(@'host=(.\S+)', 1, Message) | where IP !contains "127.0.0.1" //exclude azure local connections | summarize FirstConnection=min(TimeGenerated),LastConnection=max(TimeGenerated), Counter=count() by IP | order by Counter desc -
Summary of Successful Logins by user and database
Following Kusto Query will create a summary for all successful logins based on the selected time range in Azure UI. The data is grouped by user and database, whereas Internal connections from azure_superuser are excluded.
//Summary of Non-Replication connections by user/database AzureDiagnostics | where ResourceProvider =="MICROSOFT.DBFORPOSTGRESQL" | where Category == "PostgreSQLLogs" | where Message contains "connection authorized" | where Message !contains "replication connection authorized" | extend allmatches=extract_all(@'user=(.+)database=(.\S+)', Message) | extend user=tostring(allmatches[0][0]) | extend database=tostring(allmatches[0][1]) | where user !contains 'azure_superuser' // exclude azure connections from successful connections. User is not reported on failed ones | summarize FirstConnection=min(TimeGenerated),LastConnection=max(TimeGenerated), Counter=count() by user, database | order by Counter desc -
All Successful Logins by user and database [Optional]
Below Kusto query will list all successful logins in descending order and internal connections from azure_superuser are excluded.
//All Successful Non-replication connections
AzureDiagnostics
| where ResourceProvider =="MICROSOFT.DBFORPOSTGRESQL"
| where Category == "PostgreSQLLogs"
| where Message contains "connection authorized"
| where Message !contains "replication connection authorized"
| extend allmatches=extract_all(@'user=(.+)database=(.\S+)', Message)
| extend user=tostring(allmatches[0][0])
| extend database=tostring(allmatches[0][1])
| where user !contains 'azure_superuser' // exclude azure connections from successful connections. User is not reported on failed ones
| project TimeGenerated, user, database
| order by TimeGenerated desc
Manually create a Dashboard for monitoring connectivity
The collection of Kusto queries described in the chapter Collections of Kusto Queries Language (KQL) for monitoring connectivity can be incorporated in a fancy dashboard for a better visibility and holistic analyzes of the connectivity pattern for your Azure Database for PostgreSQL Single Server.
Below you will find all steps needed to create a dashboard for one PostgreSQL Single Server. Manually creating the dashboard allows you to arrange, customize and use the widgets created by the Kusto Queries as you prefer. You can also add other queries or metrics based on your needs.
Follow below steps to create your own dashboard:
-
From the Azure Portal go to Dashboard blade
-
From My Dashboard click on “+ New Dashboard” and choose “Blank Dashboard”
-
Edit the name based on your needs, close “Tile Gallery” and click “Save”
-
The result should be an empty dashboard as seen below
-
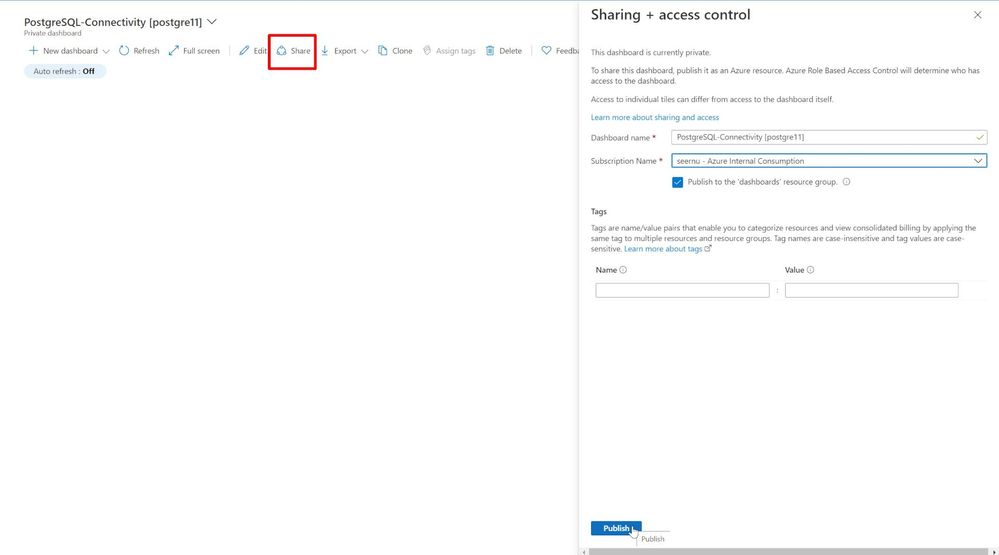
This dashboard by default is private. To share to other users in the subscription we should click the “Share” button and complete the form accordingly, then press “Publish”.
-
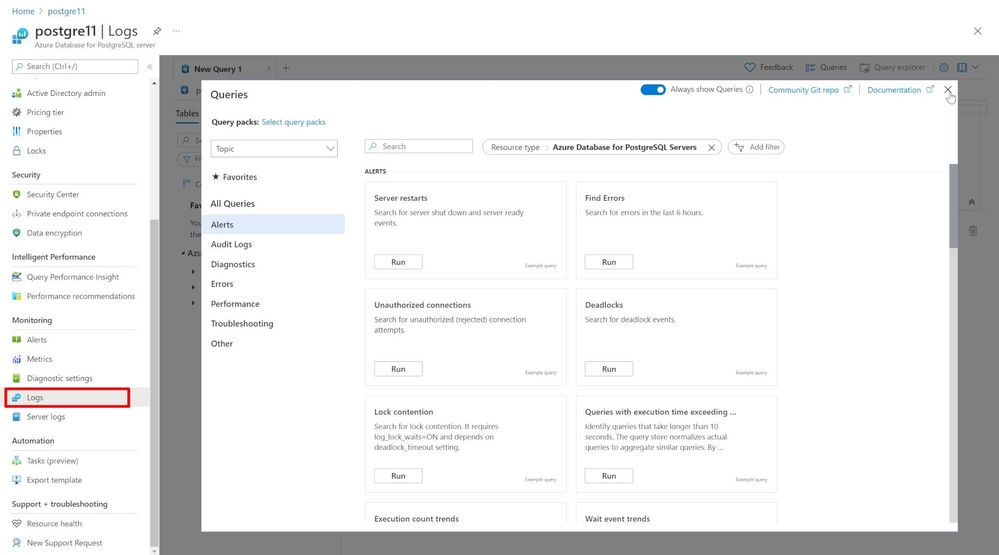
From the PostgreSQL resource in Azure Portal go to “Logs” to start adding the Kusto Queries (KQL) to be able to generate the reports. Dismiss the pop-up to be able to add the predefined KQL previously mentioned.
-
For each KQL regarding connectivity (described in previous chapter) first you need to run each one to be able to pin it to the dashboard recently created. As shown in the screenshot after successfully running each Kusto Query click on “Pin to dashboard”
-
Choose previously created dashboard (since I shared it I chose “Shared” radio-box) and click “Pin”
-
Step 7 and 8 must be repeated for the remaining Kusto queries listed in previous chapter. In other words copy and paste each query, then run and pin it to the dashboard. Make sure you run each Kusto Query before pinning it to the dashboard.
-
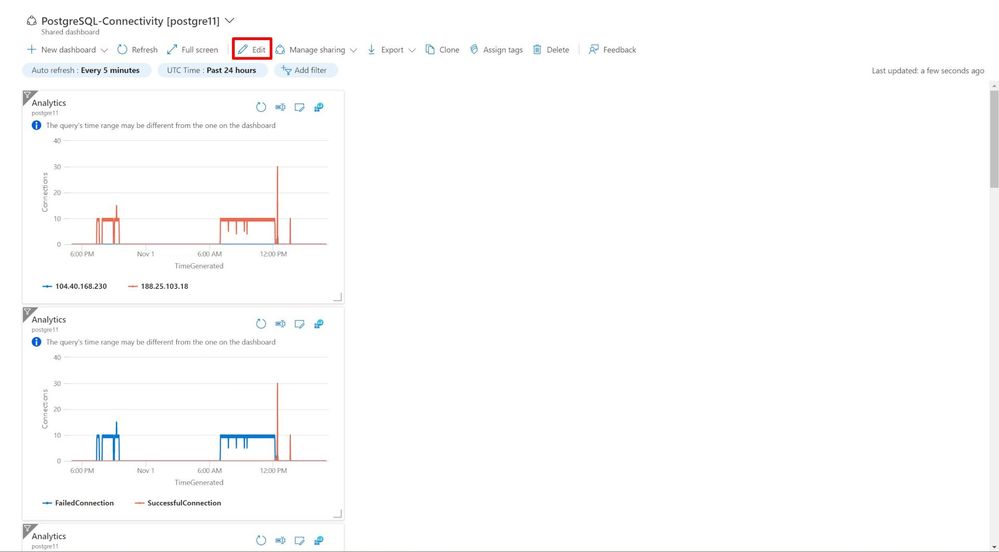
Go to the Dashboard blade and select the dashboard created. You will see all the charts arranged consecutively. To properly arrange the charts, click on “Edit” button as shown in below screenshot.
-
Arrange the tiles and customize their sizes base on preferences or screen resolution. Also, you can edit each tile title by clicking “…” button, then “Configure tile settings”. Once the customization is done press “Save” button.
We are hoping that you find this blog article helpful. Additional information can be found in following documents:
We’re always eager to get your feedback, so please reach out via email to Ask Azure DB for PostgreSQL.
Posted at https://sl.advdat.com/3p6wVWy
