Overview
Machine Learning Operationalisation (ML Ops) is a set of practices that aim to quickly and reliably build, deploy and monitor machine learning applications. Many organizations standardize around certain tools to develop a platform to enable these goals.
One combination of tools includes using Databricks to build and manage machine learning models and Kubernetes to deploy models. This article will explore how to design this solution on Microsoft Azure followed by step-by-step instructions on how to implement this solution as a proof-of-concept.
This article is targeted towards:
- Organizations looking to build and manage machine learning models on Databricks.
- Organizations that have experience deploying and managing Kubernetes workloads.
- Organizations looking to deploy workloads that require low latency and interactive model predictions (e.g. a product recommendation API).
A GitHub repository with more details can be found here.
Design
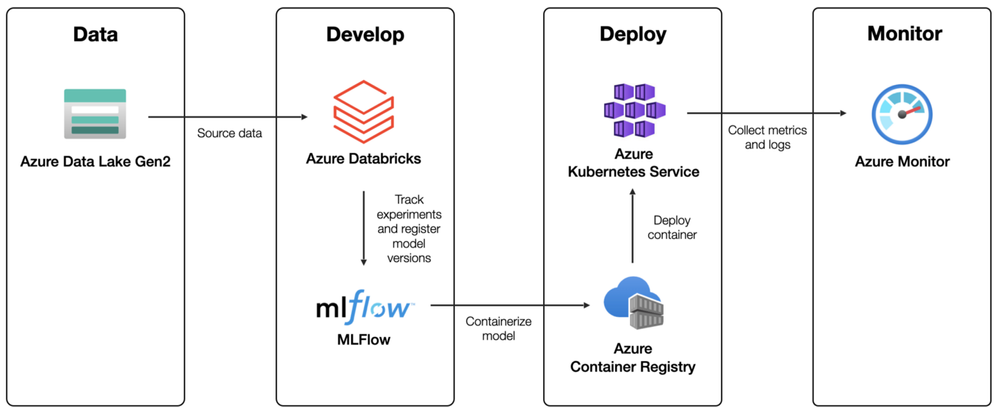
This high-level design uses Azure Databricks and Azure Kubernetes Service to develop an ML Ops platform for real-time model inference. This solution can manage the end-to-end machine learning life cycle and incorporates important ML Ops principles when developing, deploying, and monitoring machine learning models at scale.
At a high level, this solution design addresses each stage of the machine learning lifecycle:
- Data Preparation: this includes sourcing, cleaning, and transforming the data for processing and analysis. Data can live in a data lake or data warehouse and be stored in a feature store after it’s curated.
- Model Development: this includes core components of the model development process such as experiment tracking and model registration using ML Flow.
- Model Deployment: this includes implementing a CI/CD pipeline to containerize machine learning models as API services. These services will be deployed to an Azure Kubernetes cluster for end-users to consume.
- Model Monitoring: this includes monitoring the API performance and data drift by analyzing log telemetry with Azure Monitor.
Keep in mind this high-level diagram does not depict any security features large organizations would require when adopting cloud services (e.g. firewall, virtual networks, etc.). Moreover, ML Ops is an organizational shift that requires changes in people, processes, and technology. This might influence the different services, features, or workflows your organization adopts which are not considered in this design. The Machine Learning DevOps guide from Microsoft is one view that provides guidance around best practices to consider.
Build
Next, we will share how an end-to-end proof of concept illustrating how an ML Flow model can be trained on Databricks, packaged as a web service, deployed to Kubernetes via CI/CD and monitored within Microsoft Azure.
Detailed step-by-step instructions describing how to implement the solution can be found in the Implementation Guide of the GitHub repository. This article will focus on what actions are being performed and why.
A high-level workflow of this proof-of-concept is shown below:
Follow the Implementation Guide to implement the proof-of-concept in your Azure subscription.
Infrastructure Setup
The services required to implement this proof-of-concept include:
- Azure Databricks workspace to build machine learning models, track experiments, and manage machine learning models.
- Azure Kubernetes Service (AKS) to deploy containers exposing a web service to end-users (one for a staging and production environment respectively).
- Azure Container Registry (ACR) to manage and store Docker containers.
- Azure Log Analytics workspace to query log telemetry in Azure Monitor.
- GitHub to store code for the project and enable automation by building and deploying artifacts.
By default, this proof-of-concept has been implemented by deploying all resources into a single resource group. However, for production scenarios, many resource groups across multiple subscriptions would be preferred for security and governance purposes (see Azure Enterprise-Scale Landing Zones) with services deployed using infrastructure as code (IaC).
Some services have been further configured as part of this proof-of-concept:
- Azure Kubernetes Service: container insights has been enabled to collect metrics and logs from containers running on AKS. This will be used to monitor API performance and analyze logs.
- Azure Databricks: the files in repo feature has been enabled (not enabled by default at the time of developing this proof-of-concept) and a cluster has been created for Data Scientists, Machine Learning Engineers, and Data Analysts to use to develop models.
- GitHub: two GitHub Environments have been created for Staging and Production environments along with GitHub Secrets to be used during the CI/CD pipeline.
In practice within an organization, a Cloud Administrator will provision and configure this infrastructure. Data Scientists and Machine Learning Engineers who build, deploy, and monitor machine learning models will not be responsible for these activities.
Model Development
Once the infrastructure is provisioned and data is sourced a Data Scientist can commence developing machine learning models. The Data Scientist can add a Git repository with Databricks Repos for each project they (or the team) are working on within the Databricks workspace.
For this proof-of-concept, the model development process has been encapsulated in a single notebook called train_register_model.
This notebook will train and register the following ML Flow models:
- a model used to make predictions from inference data.
- a model used to detect outliers for monitoring purposes.
- a model used to detect data drift for monitoring purposes.
Training notebook in Azure Databricks
After executing this notebook the machine learning models will be registered and training metrics will be captured in the ML Flow Model Registry and Experiments tracker respectively.
In practice, the model development process requires more effort than illustrated in this notebook and will often span multiple notebooks. Note that important aspects of well-developed ML Ops processes such as explainability, performance profiling, pipelines, etc. have been ignored in this proof-of-concept implementation but foundational components such as experiment tracking and model registration and versioning have been included.
Experiment metrics for hyperparameter tuning in Azure Databricks
Registered models in Azure Databricks
This notebook has been adapted from a Databricks tutorial available here and the dataset is available from the UCI Machine Learning Repository available here.
A JSON configuration file is used to define which version of each model from the ML Flow model registry should be deployed as part of the API. All three models need to be referenced since they perform different functions (predictions, drift detection, and outlier detection respectively).
Data scientists can edit this file once models are ready to be deployed and commit the file to the Git repository. The configuration file service/configuration.json is structured as follows:
{
  "prediction_model_artifact_uri": "models:/wine_quality/1",
  "drift_model_artifact_uri": "models:/wine_quality_drift/1",
  "outlier_model_artifact_uri": "models:/wine_quality_outlier/1"
}
Model Deployment
A Machine Learning Engineer will work to develop an automated process to deploy and monitor these models as part of an ML system. Part of this requires developing a continuous integration/continuous delivery (CI/CD) to automate the building and deploying artifacts. A simple CI/CD pipeline has been implemented using GitHub Actions for this proof-of-concept. The pipeline is triggered when commits are pushed, or a pull request is made to either the main or development branch.
The CI/CD pipeline consists of three jobs:
- Build: this job will create a Docker container and register it in ACR. This Docker container will be the model inference API which end-users will consume. This container has been developed using BentoML and the three machine learning models.
- Staging: this job will deploy the Docker container to the AKS cluster in the staging environment. Once deployed, the models’ state will transition to the Staging state in the ML Flow model registry.
- Production: this job will deploy the Docker container to the AKS cluster in the production environment. Once deployed, the models’ state will transition to the Production state in the ML Flow model registry.
With BentoML you define the prediction service, trained machine learning models, code, specifications, and dependencies to create a package that can be used to build a docker container image.
The prediction service used in this proof-of-concept consists of a single endpoint called predict. It is implemented using the three machine learning models, a Conda Environment file specifying the dependencies of the model inference API and a setup script. When a user calls this endpoint the request will be passed and the provided records will be consumed in all three models. This will generate a list of predictions, output to indicate if data drift is present for any of the features, and output to indicate if outliers are present for any of the features. The results will be returned to the client and the drift and outlier metrics will be logged for future analysis.
The prediction service used in this proof-of-concept is defined in service/model_service.py. An extract of the code used to define the prediction service an outline shown below:
# ... import python packages

@env(infer_pip_packages=True, setup_sh="./service/setup.sh")
@artifacts([XgboostModelArtifact("prediction_model"), SklearnModelArtifact("drift_model"), SklearnModelArtifact("outlier_model")])
class WineQualityService(BentoService):
    def generate_predictions(self, df: pd.DataFrame):
        # ... return predictions from `prediction_model`

    def generate_monitoring_results(self, df: pd.DataFrame):
        # ... return metrics for monitoring from `drift_model` and `outlier_model`

    @api(input=DataframeInput(orient="records", columns=COLUMN_NAMES), output=JsonOutput(), batch=True)
    def predict(self, df: pd.DataFrame):
        # Setup bentoml logger
        logger = logging.getLogger('bentoml')

        # ... some more code

        # Generate predictions
        prediction_results = self.generate_predictions(df)
        monitoring_payload = self.generate_monitoring_results(df)

        # ... some other code

        # Log output data
        logger.info(json.dumps({
            "service_name": type(self).__name__,
            "type": "output_data",
            "predictions": prediction_results,
            "monitoring": monitoring_payload,
            "request_id": request_id
        }))

        return [{ "predictions": prediction_results, "monitoring": monitoring_payload }]
Within the Build job of the CI/CD pipeline, the model artifacts will be downloaded from the Databricks ML FLow Model Registry. BentoML will create a package using the model artifacts and related code which is used to produce a container image of the model inference API. This container image is then stored in ACR.
The Staging job will automatically be triggered after the Build job has been completed. This job will deploy the container image to the AKS cluster in the staging environment. A Kubernetes manifest file has been defined in manifests/api.yaml that specifies the desired state of the model inference API that Kubernetes will maintain.
Environment protection rules have been configured within GitHub Actions to require manual approval from approved reviewers before the Docker container is deployed to the production environment. This provides the team with greater control over when updates are deployed to production.

GitHub Action CI/CD workflow production deployment approval
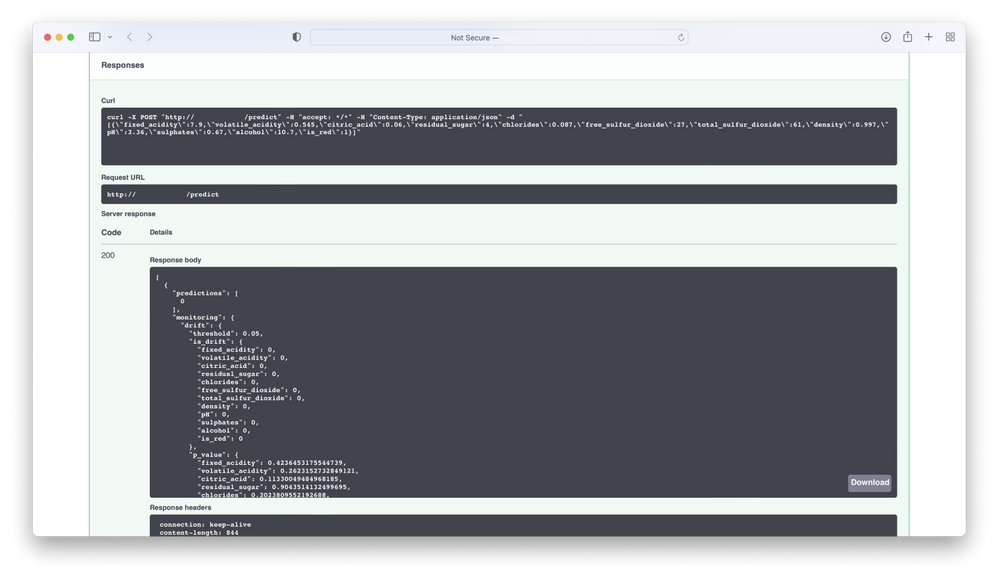
After approval has been given and the model inference API has been deployed the Swagger UI for the service can be accessed from the IP address of the Kubernetes ingress controller corresponding. This can be found under the AKS service in the Azure Portal or via CLI.

For production scenarios, a CI/CD pipeline should consist of other elements such as unit tests, code quality scans, code security scans, integration tests, and performance tests. Moreover, teams might choose to use Helm charts to easily configure and deploy services onto Kubernetes clusters or use a Blue-Green or Canary deployment strategy when releasing their application.
Model Monitoring
Once the application is operational and integrated with other systems a Machine Learning Engineer can commence monitoring the application to measure the health of the API and track model performance.
Once models are operationalized, monitoring their performance is essential to prevent degradation. This can be caused by changes in the data and relationships between the feature and target variables. When these changes are detected it indicates that the machine learning model needs to be re-trained by Data Scientists. This can be accomplished manually through alerts or automatically on a schedule.
Within this proof-of-concept, container insights for AKS have been enabled to collect metrics and logs from the model inference API. These can be viewed in Azure Monitor. The Azure Log Analytics workspace can be used to analyze drift and outlier metrics logs from the machine learning service whenever a client makes a request.
The model inference API accepts requests from end-users in the following format:
[{"fixed_acidity": 7.9,
 "volatile_acidity": 0.545,
 "citric_acid": 0.06,
 "residual_sugar": 4.0,
 "chlorides": 0.087,
 "free_sulfur_dioxide": 27.0,
 "total_sulfur_dioxide": 61.0,
 "density": 0.997,
 "pH": 3.36,
 "sulphates": 0.67,
 "alcohol": 10.7,
 "is_red": 1
}]
When the model inference API is called it logs telemetry that relates to input data, drift, outliers, and predictions. This telemetry is collected by Azure Monitor and can be queried within an Azure Log Analytics workspace to extract insights.

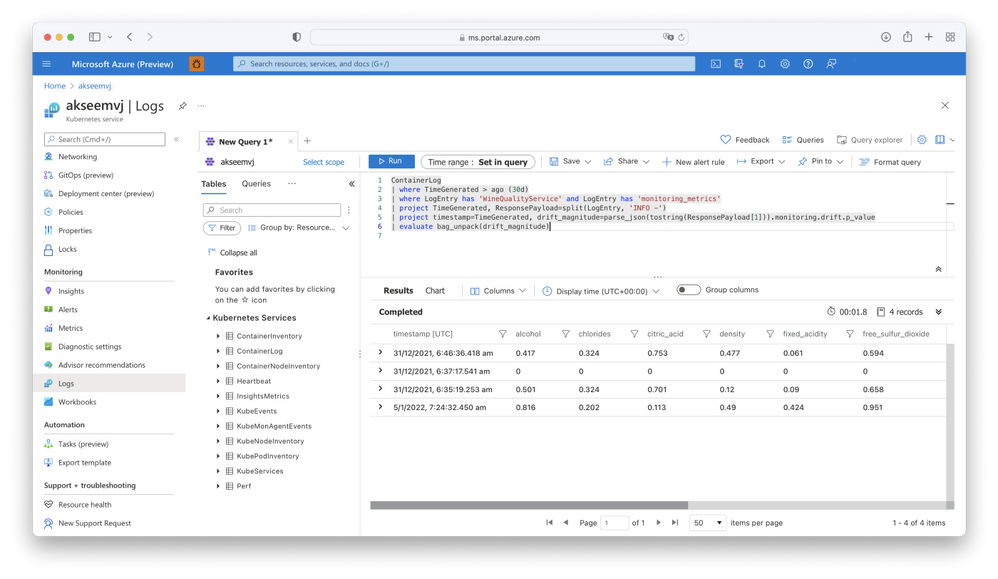
Within the Azure Log Analytics workspace, a query can be executed to find all logs relating to the specific model inference API within a time range, WineQualityService in this proof-of-concept, and parse the result to extract drift results. These values correspond to p-values and can be used to determine if data drift is present. Any feature with a p-value less than a pre-defined threshold has undergone drift (the threshold is 0.05 for this proof-of-concept).

Querying container logs to extract data drift values
Azure Log Analytics is capable of executing more complex queries such as moving averages or aggregations over sliding values. These can be tailored to the requirements of your specific workload. The results can be visualized in a workbook or dashboard, or used as part of alerts to proactively notify Data Scientists and Machine Learning Engineers of issues. Such alerts could indicate when Data Scientists or Machine Learning Engineers should re-train models or investigate concerning changes.
To re-train models, inference data from requests need to be collected and transformed. This can be achieved by configuring data export in your Log Analytics workspace to export data in near-real-time to a storage account. This data can be curated and stored in a feature store for subsequent use as part of a batch process (using Databricks for example).
From this, a continuous training (CT) pipeline can be developed to automate model re-training, update the model version in the ML Flow Model Registry, and re-trigger the CI/CD pipeline to re-build and re-deploy the model inference API. A CT pipeline is an important aspect of well-developed ML Ops processes.
Resources
You may also find these related articles useful:
- Machine Learning Operations Maturity Model
- Team Data Science Process
- Modern Analytics Architecture with Azure Databricks
- Sharing Models Across Workspaces in Databricks
This article was originally posted here.


