Secrets from the Deep - The DNS Analytical Log - Part 5
Hi Team, it's Eric Jansen again, here today to continue where we left off in Part 4 of the series. In the last episode, we discussed how to parse the collected data from the Analytical Log and re-write it to a classic log, showing the harvested 'data of interest'. This time, I'll take a pause on some of the data parsing to discuss the differences between the Legacy DNS Debug Logging and compare it to the Analytical Logging.
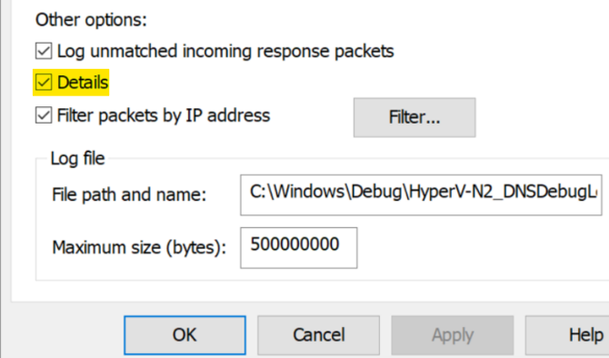
OK, so let's break things down for a better understanding what I mean by "Legacy DNS Debug Logging", for those unfamiliar with it, since I'm assuming that if you've made it to part five of this series, you know what DNS Analytical Logging is by now. When you go to the properties of a Microsoft DNS Server within the DNS management console, you'll see a tab called 'Debug Logging' with various options to select for log collection, as seen here:
In addition to the GUI, you can also get (Get-DNSServerDiagnostics) and set (Set-DNSServerDiagnostics) these values programmatically, via PowerShell.

As a matter of fact, if we use the GUI to enable Debug Logging and configure some options, and then compare to what you see in PowerShell, you'll find that you have additional options that you can define via PowerShell that you don't have in the GUI, or so it would appear:
This can be confusing; The key thing to keep in mind though, is that when using Set-DNSServerDiagnostics it configures both 'Debug Logging' and 'Event Logging' options, and the purpose of this post is going to compare just the legacy debug logging options to the analytical debug logging options. As far as each of the DNS server diagnostics options are concerned, I won't be covering those, as it's pretty well documented here: Set-DnsServerDiagnostics (DnsServer) | Microsoft Docs
I will, however, poach and paste some of the useful data from that link, as it pertains to the legacy debug logging options. In particular, the -DebugLogging parameter, which changes the debugging configuration via the toggling of bitmask values. If unfamiliar with bitmask values, when combined they can create a single value that reflects multiple configuration settings.
-DebugLogging
Specifies the bitmask for debug logging. Valid values are:
- 0x00000001. The server logs query packet exchanges.
- 0x00000010. The server logs packet exchanges that are related to zone exchanges.
- 0x00000020. The server logs packet exchanges that are related to zone updates.
- 0x00000100. The server logs packets that contain questions.
- 0x00000200. The server logs packets that contain answers.
- 0x00001000. The server logs packets that it sends.
- 0x00002000. The server logs packets that it receives.
- 0x00004000. The server logs User Datagram Protocol (UDP) packet exchanges.
- 0x00008000. The server logs Transmission Control Protocol (TCP) packet exchanges.
- 0x0000FFFF. The server logs operations if you set the following fields to $True: 0x00001000, 0x00002000, 0x00008000, 0x00004000, 0x00000001, 0x00000001, 0x00000020, 0x00000100, and 0x00000200S.
- 0x00010000. Independent of other field values, this bitmap logs Active Directory write operations.
- 0x00020000. Independent of other field values, this bitmap logs Active Directory polling operations and operations that occur during DNS updates (secure and not secure) on Active Directory-integrated zones.
- 0x01000000. If other field values allow it, the server logs the entire packet to the log file.
- 0x02000000. If other field values allow it, the server logs response packets that do not match any outstanding queries.
- 0x80000000. If other field values allow it, the server saves packet logging information to persistent storage.
Unfortunately, the Get-DNSServerDiagnostics doesn't have a -ShowDebugLoggingValue for us nerds to look at, because it just reads that UInt32 value and presents the easier to read configuration settings to the screen, but if you're interested, the value is written to the registry and can be found here:
Get-ItemProperty HKLM:\SYSTEM\CurrentControlSet\Services\DNS\Parameters -Name LogLevel
OR, if it was a recent change that was made, you can also see it in the DNS Audit logs, which I haven't talked about very much - but probably should (and I will a little more below):
Not a ton of value in knowing that, really, since even if your goal was to programmatically configure the legacy debug logging options on a DNS Server or servers you could still meet those goals with the built-in parameters of Set-DNSServerDiagnostics.
Anyhow, back to the comparison discussion, for this I'll break it down into the following categories for comparison: Logging Options, Performance, Parsing
Logging Options:
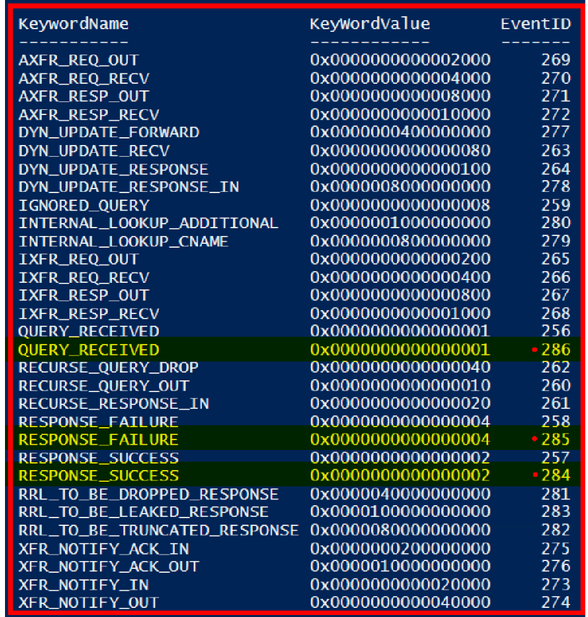
If we just put the logging options that I showed how to dump out of the provider back in Part 1 and again, updated in Part 3 of the series and compared it to the bitwise options for the -DebugLogging parameter that I showed in the section above for the Set-DNSServerDiagnostics cmdlet, from a glance, it might look like they were pretty even as far as what gets logged. Especially since roughly 72% of the options for what gets returned by the provider is for data that gets sent to the Audit log:
Note: For clarity on the 72% comment above, though the list below shows all the KeywordNames, it does not show all Event IDs associated with each KeywordName (it would scroll off the page). The DNSServer provider for Server 2019 (I know, I know, I need to update my lab...) actually has 112 Events, 81 of which are destined for the Audit Log. If anyone is interested in seeing that code addition with the Event Descriptions, let me know in the comments below.
Get-ProviderKeyWordData -Provider "Microsoft-Windows-DNSServer" | Sort KeywordName
For the sake of being complete, however, here’s the full list of Events destined for the Analytic Log. There are three more events that have duplicate KeywordNames from what’s seen highlighted in red above:
In case anyone is wondering, the differences for those three events are related to EDNSCorrelationTags that are included in those event messages. I didn’t want to try to shoehorn each of the event descriptions in the screenshot above since some of them are pretty long. Regardless, the list above is what would be used to directly compare against the Legacy DNS Debug Log.
So, though the data sent to the Legacy DNS Debug log and the DNS Analytic Log look comparable, and though some things are, there are subcategories of data in the Analytic Log events for newer DNS features that don’t exist in the Legacy Log. Conversely the Legacy Log has a few things that the Analytic Log does not.
You can see an example of this back in Part 3, where I show the event structure for Event ID 258 using the -ShowEventStructure parameter that I added the Get-ProviderKeyWordData function (the code can also be found in Part 3). So, if you were to run the following:
Get-ProviderKeyWordData -Provider "Microsoft-Windows-DNSServer" -ShowEventStructure
It would dump the event structures for the original list of Events that I dumped out of DNS Server provider.
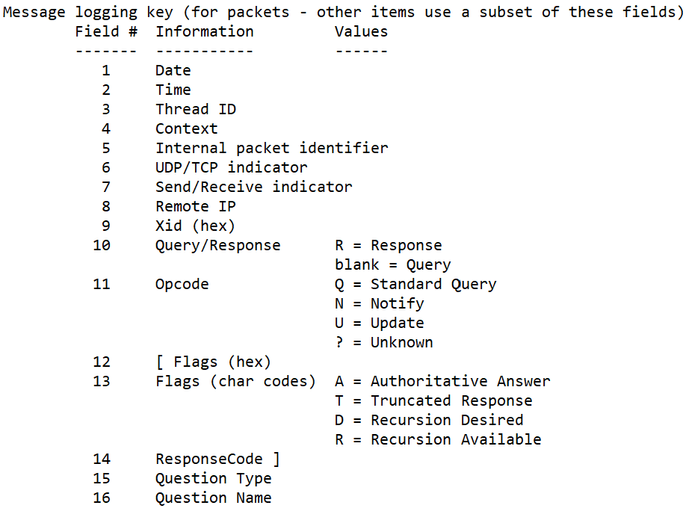
Unfortunately, I don’t have a similar function to show the event structures for the legacy log since they aren’t categorized as specific event IDs, however there is a ‘Message Logging Key’ found at the beginning of the legacy log, seen here:
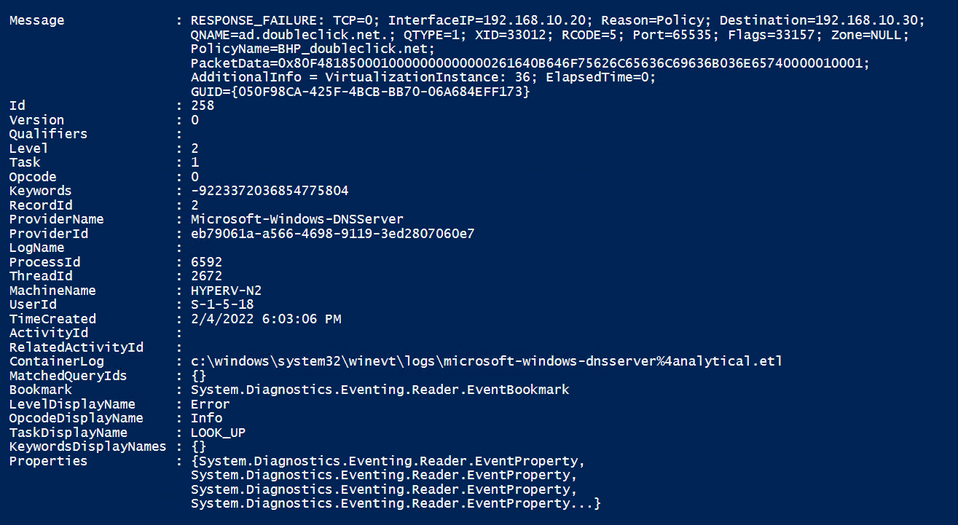
But let’s compare ‘Apples to Apples’ for at least one bit of log ‘Context’. We’ll look at the PACKET context and look at a Response Failure from each log (with the ‘Details’ option selected in the Legacy DNS Debug Log) to see the difference:
Legacy Debug Log:
Analytic Debug Log:
OK, so first of all, in order to even get similar data in the Legacy log, you MUST enable ‘details’, which in and of itself can be problematic – more on that later. But let's look at some other more obvious differences. Here’s a handful that stand out to me:
- In the Legacy Log, we can only see that the query was refused, we don’t know why; where in the Analytic log, it shows not only that the reason was due to a policy that was on the server, but specifically which policy – this is a big one.
- I have multiple NIC Teams and interfaces on this Hyper-V Node, and the DNS Server is listening on 4 of them. In looking at the Analytic Log, I know which one responded with the failure, where the Legacy log doesn’t show that.
- Keep in mind that ‘Interface IP’ is one of the seven criteria that can be used when creating a Query Resolution Policy, so that could be important troubleshooting information.
- The Analytic Log is in more of a human readable format, where the hex conversions are done for you before data is written, and the data has ‘header’ values to show what they are without needing to refer to a ‘Message Logging Key’.
- The Legacy Log is missing data that I consider critical for tracing operations, such as the Message GUID.
- The Legacy Log, (when ‘Details’ are enabled), does show Packet data, but not all Packet data, so in the end, depending on what you’re looking for, you may still need to do a Wireshark trace.
- But in reality, does anyone leave network traces running full time on their servers? Maybe they do, but I see very little value in it unless I’m specifically troubleshooting something. Having Packet data show up in the Legacy Log for servers that could have thousands of queries per second just isn’t a great use of space and processing to me for a log that would wrap somewhat quickly with that type of traffic.
Keep in mind that the above just compares the PACKET ‘Context’ of the Legacy Log (and just one packet type), but additional ‘Context’ / log data is written to the Legacy Log as well to include INIT, DSPOLL, DSWRITE, LOOKUP, PLUGIN, RECURSE, REMOTE, and TOMBSTN data as well. The PACKET ‘Context’ is just BY FAR the most commonly seen in the Legacy Log though (at least in my experience), so that’s why I chose that for comparison.
In addition to that, as I’ve previously discussed, the DNS Analytic Logging gives you more granular control of what you log when using customized NetEventSessions should you decide that the default settings of the Analytical Log don’t meet your requirements, but it’s also the data that gets returned for each of these.
Below is a bit of a high-level comparison chart (and is by no means and all-inclusive comparison list):
Note: The comparison chart will be excluding provider data with keywords defined above that are prefixed with ‘AUDIT’, because though it’s a single DNS provider, it provides data for both the DNS Analytic and Audit logs.
|
Logged Data |
Legacy DNS Log |
DNS Analytic Log |
|
Packet Data |
☒ |
☒ |
|
Server Initialization (Service Start / Stop / Settings Application) |
☒ |
☒ |
|
Active Directory DNS Node Tombstone Updates - For Nodes that are past their Tombstone Lifetime |
☒ |
☒ |
|
Active Directory DNS Polling Operations |
☒ |
☒ |
|
Active Directory Zone Write Operations |
☒ |
☒ |
|
Plug-In DLL interaction |
☒ |
☒ |
|
RecursionScope Data |
☒ |
☒ |
|
CacheScope Data |
☒ |
☒ |
|
ZoneScope Data |
☒ |
☒ |
|
RateResponseLimiting Data |
☒ |
☒ |
|
Policy Data |
☒ |
☒ |
|
Reasoning for Success / Failure / Ignored Queries |
☒ |
☒ |
|
Interface IP |
☒ |
☒ |
|
Forwarder Interface IP |
☒ |
☒ |
|
Conversation GUID |
☒ |
☒ |
As you can see in the comparison chart, when it comes to anything that’s DNS Policy related, the legacy debug logging is of no value - it logs nothing of the sort. That and it lacks some of the items that I talked about earlier like the interfaces and conversation GUID data among others.
The Legacy Log does include some items that the Analytic Log does not though, but most have limited value since they’re either logged elsewhere, or auditing can be configured to collect that information. For example, DNS start / stop activities, those are logged in both the System and DNS Server Event Logs, so I don’t need the Debug Log for that information. There’s also DNS Tombstone Update data, Zone Loading data (the option to enable to see DSPOLL data), and DSWrite data (for when records are added or deleted among other DS write operations), but your auditing configuration should cover that and a lot more when it comes to directory-based DNS changes. If not, see Hilde’s blog on AD Integrated DNS Auditing for more information on that. Ah, but you say the Legacy Log also shows DNS Plug-In interactions (this one item warrants its own blog) and DSPolling information! It does and that may be useful to you since it’s not logged in the Audit Log or DNS Server Log, but my point is – there’s always another way and there’s no great reason, at least that I can think of, that would have me tell my customer base that they should keep using the Legacy DNS Debug Logging.
Please comment below if you have a great use case that I’m not considering.
Parsing:
The parsing comparison may or may not matter to you since there are third party tools that can do this for you. If you want to write your own code on the other hand, then this portion could be somewhat subjective, based on your background and experience. Personally, I think it's easier to collect and parse data from the Analytical debug logging over the Legacy debug logging.
The Analytical Logging, as you know, if you've been following the series, is stored in the .ETL (event trace log) format. That format is created by using the Event Tracing for Windows (ETW) API, which consists of providers (that feed the events into the session), controllers (that control the session), and consumers (which request events from a session). In short what that means is that rather than logging simple strings they log event objects that are defined / structured by the provider into a known format, which makes it easier to parse (at least with my experience and in my opinion - I'm definitely not a developer).
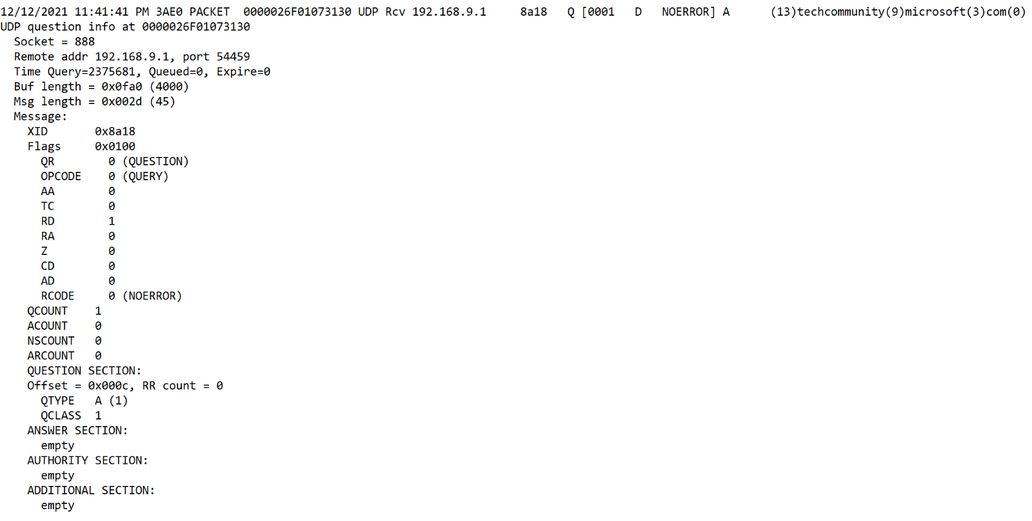
Conversely, the legacy logging is essentially unstructured 'text logging'; where string data is sent to the log, and depending on the selected options, you'd have to have separate parsing methods. For example, if I have the "Details" check box selected in the "Other Options" section, each packet has multiple lines of data that would more closely resemble what you'd see in a trace with a packet analysis tool. If "Details" is deselected, then it just presents a single line of data. Either one could be parsed with regular expressions or string manipulation
'Details' selected:
'Details' deselected:
Performance / Impact:
As usual, when discussing performance, there are too many variables at play across customer environments, so we don't publish numbers anymore to show performance gains or losses. For actual performance numbers, baseline testing would need to be done per environment. If you did want to test on your own, you can use the various DNS Counters available in Performance Monitor for testing various metrics such as Total Query Received/Sec and Total Response Sent/Sec among others - just depends on what you're trying to baseline before making changes. Obviously if you have a small environment supporting just a few queries per second (QPS) you won't see the same impact as an enterprise with servers servicing 50,000+ QPS.
What I can say in regard to performance though, is that the use of the legacy DNS Debug Logging can have a negative performance impact - this has been documented for many years as seen in the 'Performance Considerations' section of the DNS Logging and Diagnostics doc. Enabling DNS Debug logging can lead to the DNS Server Service having severe performance issues. It's not just degraded performance, however, we have had numerous cases regarding both performance and stability impact, most notably when the 'details' checkbox is selected:
As seen in the parsing section above, there's a considerable difference in what's logged when the 'Details' box is enabled vs disabled. From a performance perspective, the QPS that the server can support can be drastically reduced and DNS Server service can enter a deadlock state where it can neither respond to queries nor write to the DNS debug log. The deadlock issues can occur when multiple threads are trying to log at the same time. This can cause the server to have high CPU usage, intermittent hanging of DNS, and even cause DNS to crash.
Another example that can cause impact that involves the DNS Debug log is related to disk space, but its more attributed to the misunderstanding of some of the configuration options that get set when using the Set-DNSServerDiagnostics cmdlet - specifically, the 'EnableLogFileRollover' parameter. That parameter can be set specifically, but more often than not, it's accidentally enabled when admins choose the 'All' parameter, setting it to $true. At this point, if the admin doesn't have an understanding of what that does, it turns into a ticking time bomb. When the 'EnableLogFileRollover' is set to true, it auto creates debug log files that are by default 500MB in size, with the log file name timestamped with a name like dns2021-12-31T233747Z.log. When that log file reaches 500MB in size, it rolls over and creates a new 500MB log file. This keeps happening until either the drive fills up, or the files are deleted or archived to another location. Depending on the debug log options that you have defined, the amount of DNS traffic that the server gets (that has to be logged), how big the hard drive is, and if drive space is being monitored depends on when the bomb goes off. Once that drive fills up and the logs can't be written to, DNS ceases to function…
I had a scenario about five years ago when this happened to a large customer where the drives filled up on all of their resolvers in one of their US data centers, and DNS traffic failed over to one of their Asian datacenters. Just imagine DNS going down on one server, then clients moving on to use another in their list where now even more traffic is going to it, taking that next one down even faster, and then the domino effect after that. Fortunately, they didn't go down because they had failover in place, but there was a noticeable degradation of services. It could have been a lot worse than it was, this is just one more example of impact that can be had by enabling the DNS Debug Logs - even if this was intentionally / administratively configured. One lesson learned here is that you need to understand what you're configuring before implementing it in a large enterprise.
Key Takeaways:
The key takeaways regarding the DNS logging options:
- The DNS Analytic log is more performant than the legacy DNS logging.
- For maximum performance, both the Legacy and Analytic logging should only be turned on for troubleshooting purposes (However there are some good use cases for keeping the Analytic logging turned on as I've discussed previously in this series.)
- The Analytic log contains a lot of data that the legacy DNS debug logging does not, but there's a few things that the Legacy Log contains that the Analytic log does not (even though those things could be audited via other means.)
- The Analytic log is more customizable than the legacy DNS debug logging (if creating custom event sessions).
- The Analytic log is easier to parse than the legacy DNS debug log (at least for me / in my opinion).
- There is more publicized and useful documentation around the DNS analytic logging. (And more is coming, at least in my blog series.)
- In the end, we recommend using the DNS analytic log and not using the legacy DNS debug log.


