Sign up here
Detecting performance issues in today’s applications and web services can be challenging. Even with the right profiling tools and an abundance of profiler data, it can be hard for developers to efficiently uncover useful insights. For instance, manually sifting through gigabytes of profiler data can be tedious and time consuming.
One of the common ways to address performance issues is to scale out cloud resources. While it may feel like a reasonable solution in the short run, the resulting costs can add up over time and even cause problems such as cloud sprawling, which can be a maintenance nightmare.
Today, we’re excited to announce the limited preview of Optimization Insights, an AI-based service within Application Insights that continuously detects performance issues in your application or cloud service and provides recommendations on how to fix them.
Optimization Insights automatically analyzes profiler traces, helping developers be more productive by focusing on what matters the most – i.e., fixing the performance issues quickly and validating that the solutions work.
Our service can currently provide targeted insights for a growing list of 40+ performance issues. These issues encompass a wide variety of performance problems seen in .NET applications ranging from incorrect API usages and unnecessary allocations all the way to issues relating to exceptions and concurrency. In addition to these issues, Application Insights can also detect anomalies whenever an application or cloud service exhibits abnormal CPU or Memory behavior.
If you are trying to optimize the performance of your application or troubleshoot complex performance issues before they become serious, please consider signing up for the Optimization Insights limited preview here at no additional cost and let us know what you think.
Continuously uncover complex performance bugs
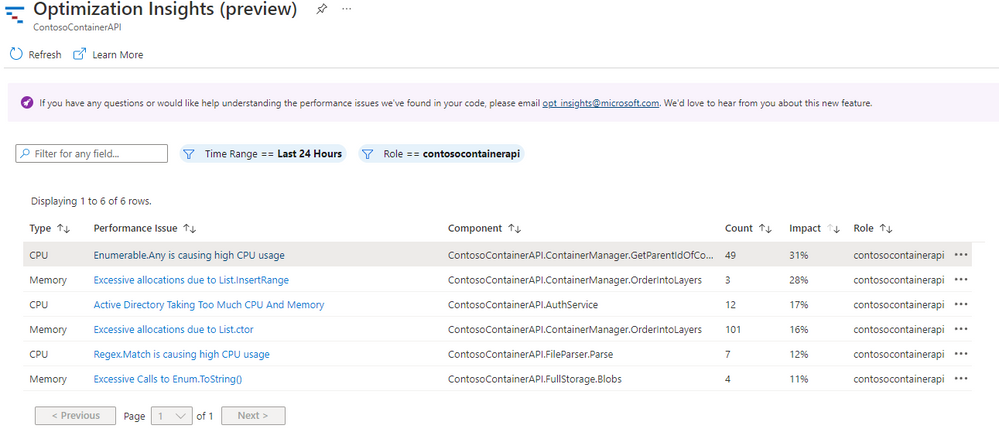
After signing up for the preview, you will get access to the Optimization Insights panel, where we show you all the performance issues that we have identified for your application in the last 24 hours.
For a given time range, the Optimization Insights UI shows the performance issue’s impact (i.e., max CPU or Memory usage), count (i.e., number of times it occurred), and corresponding role. Upon clicking on the issue, the UI displays a detailed description along with recommendations on how to fix it.
Upon clicking on the call stack button, the UI shows the full call stack to help you find out where in your code the performance issue is occurring.
How does this work?
To detect these insights in your application or cloud service, our service relies on an AI model trained on thousands of traces collected from Microsoft-owned services around the globe. By learning from these traces, the model is able to glean patterns corresponding to various performance issues seen in .NET applications and learn from the expertise of performance engineers at Microsoft. This enables our AI model to pinpoint with accuracy a wide range of performance issues in your app.
The Optimization Insights service is built entirely using Azure. Behind the scenes, it consists of a smart sampling agent that samples from the profiles captured on your app every X minutes. These samples are then sent to the AI model to extract the most relevant insights, recommendations, and anomalies.
Learn more about the service
Watch this demo video to see Optimization Insights in action and learn how it can help you identify and remove CPU and Memory bottlenecks by analyzing the runtime behavior of your application and comparing it to performance engineering best practices.
You can sign up now here to try out this new service.
Posted at https://sl.advdat.com/3i306Wehttps://sl.advdat.com/3i306We


