Introduction:
Recently, due to security and privacy compliance, Query Text is no longer shown on Query Performance insights for Azure PostgreSQL and Azure MySQL. this to help avoiding unauthorized access to the query text, preventing any expose to the underlying schema, and minimizing the security risks.
In this blog article, we will provide some SQL/KQL queries to get more insights on the running queries. and how to obtain the Query text from the database.
Solution:
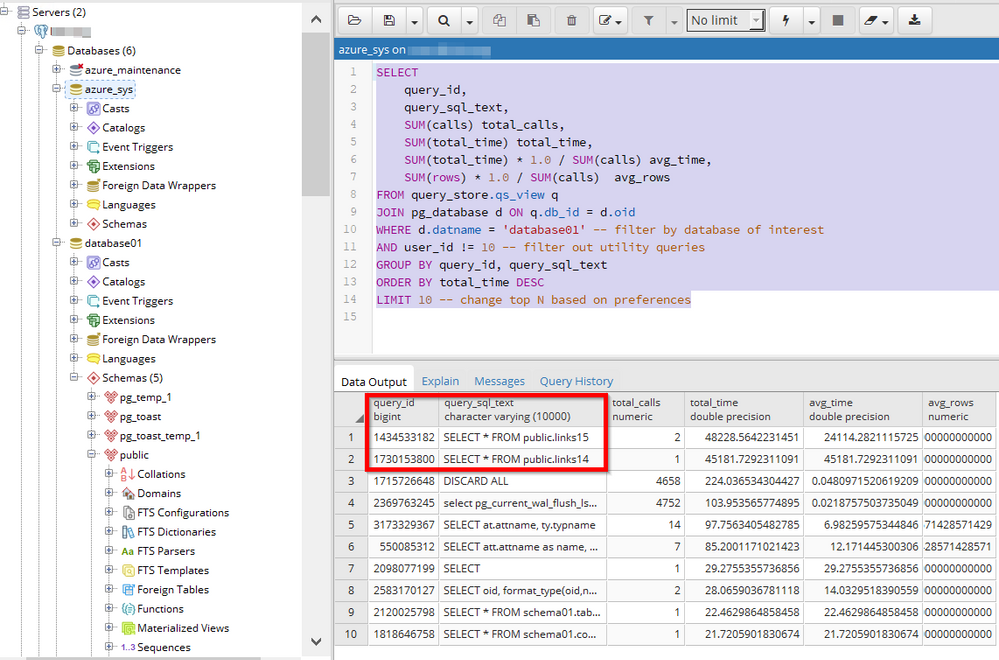
Although query text is not available on the query performance insight portal, you still can use the Query Performance insights to obtain the query ID, and then you can obtain the query text by connecting to azure_sys database on your PostgreSQL Server and query on 'query_store.query_texts_view'. as shown in below figures:
You can use below query to get the top 10 query, you can also adjust the order by clause to your preferences:
SELECT
    query_id,
    query_sql_text,
    SUM(calls) total_calls,
    SUM(total_time) total_time,
    SUM(total_time) * 1.0 / SUM(calls) avg_time,
    SUM(rows) * 1.0 / SUM(calls)  avg_rows
FROM query_store.qs_view q
JOIN pg_database d ON q.db_id = d.oid
WHERE d.datname = 'database01' -- filter by database of interest
AND user_id != 10 -- filter out utility queries
GROUP BY query_id, query_sql_text
ORDER BY total_time DESC
LIMIT 10 -- change top N based on preferences
P.S:- for Azure MySQL, you can use mysql.query_store and mysql.query_store_wait_stats to view the query text, more information can be found at: Query Performance Insight - Azure Database for MySQL | Microsoft Docs
When you enable Query Store - Azure Database for PostgreSQL - Single Server | Microsoft Docs, you can use the log analytics premade KQL queries or custom queries to get more insights on the running queries, As shown in below screenshots.
Note:- Allow up to 20 minutes for the first batch of data to persist in the azure_sys database.
In Addition, You can enable diagnostic settings for your Postgres server, Diagnostic settings allows you to send your Postgres logs in JSON format to Azure Monitor Logs for analytics and alerting, Event Hubs for streaming, and Azure Storage for archiving. The log categories to configure are QueryStoreRuntimeStatistics and QueryStoreWaitStatistics.
Query example #1:
// Slowest queries
// Identify top 5 slowest queries.
AzureDiagnostics
| where ResourceProvider == "MICROSOFT.DBFORPOSTGRESQL"
| where Category == "QueryStoreRuntimeStatistics"
| where user_id_s != "10" //exclude azure system user
| summarize avg(todouble(mean_time_s)) by event_class_s , db_id_s ,query_id_s
| top 5 by avg_mean_time_s desc
Query example #2:
let TimeCheckStart = ago(3d);
let TimeCheckEnd = now();
let TopQueryNumber = 15;
let ServerName = 'XXXXXX'; // add the server-name
let WindowSize = 1s;
let TopQuery =AzureDiagnostics
    | where LogicalServerName_s == ServerName
    | extend executionCount = calls_s
    | where todatetime(start_time_s) > TimeCheckStart and todatetime(start_time_s) < TimeCheckEnd
    | where user_id_s != 10 // exclude azure super user
    | summarize sum(todouble(total_time_s)) by query_id_s, LogicalServerName_s
        | top TopQueryNumber by sum_total_time_s desc;
AzureDiagnostics
| where LogicalServerName_s == ServerName
| where todatetime(start_time_s) > TimeCheckStart and todatetime(start_time_s) < TimeCheckEnd
| join kind = inner TopQuery on query_id_s
| extend TIMESTAMP = bin(todatetime(start_time_s), WindowSize)
| summarize sum(todouble(total_time_s)) by TIMESTAMP, query_id_s
| evaluate pivot(query_id_s, sum(sum_total_time_s), TIMESTAMP)
| order by TIMESTAMP asc
| render timechart
Sample output:
Query example #3:
You can use query below to check specific query based on query id, you need to update the server name, and query id.
//Use to check specific query based on query id above
let TimeCheckStart = ago(7d);
let TimeCheckEnd = now();
let ServerName = 'XXXXXXX'; //Add the server name
let WindowSize = 1m;
AzureDiagnostics
| where LogicalServerName_s =~ ServerName
| extend executionCount = calls_s
| where todatetime(start_time_s) > TimeCheckStart and todatetime(start_time_s) < TimeCheckEnd
| where user_id_s != 10 // exclude azure super user
| where query_id_s == "YYYYYYYYYY" // check specific query id
| extend TIMESTAMP = bin(todatetime(start_time_s), WindowSize)
| summarize total_time = sum(todouble(total_time_s)), avg_time = avg(todouble(mean_time_s)), total_calls = sum(todouble(calls_s)), total_rows = sum(todouble(rows_s)) by TIMESTAMP
| order by TIMESTAMP asc
| render timechart
Sample output:
Additional References:
Monitor and tune - Azure Database for PostgreSQL - Single Server | Microsoft Docs
Logs - Azure Database for PostgreSQL - Single Server | Microsoft Docs
Query Store - Azure Database for PostgreSQL - Single Server | Microsoft Docs
Query Performance Insight - Azure Database for PostgreSQL - Single Server | Microsoft Docs
Disclaimer
Please note that products and options presented in this article are subject to change. This article reflects the query performance insights available for Azure database for PostgreSQL in March, 2022.
Closing remarks
We hope you find this article helpful. If you have any feedback, please do not hesitate to provide it in the comment section below.
Ahmed S. Mazrouh
Posted at https://sl.advdat.com/3sAzyl1https://sl.advdat.com/3sAzyl1


