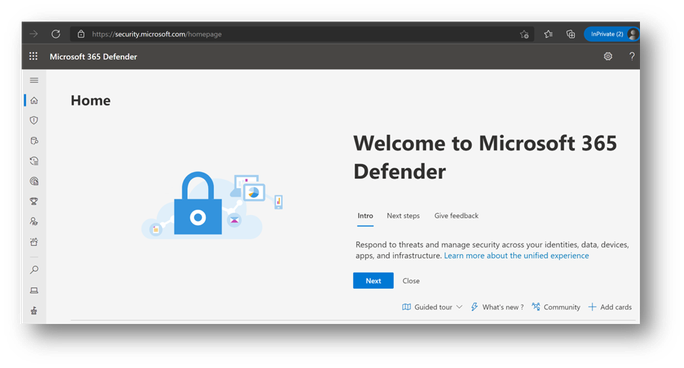
We are excited to announce the new Endpoint reporting capabilities within the Microsoft 365 Defender portal. This work brings new endpoint reports together so you can see what is happening in your environment with just a couple clicks. Our reports are designed to provide insight into device behavior and activity while allowing you to take full advantage of the integrated experiences within Microsoft 365 Defender portal, such as device timeline and advanced hunting. The two reports covered in this announcement are:
These two reports are found in the Reports page in the Endpoints node.
Device Control Report
The Device Control report is now generally available. This report is designed to show the activity and usage of external devices.
About the device control report
With the device control report, you can view events that relate to external media usage on endpoints
- Audit events: shows the number of audit events that occur when external media is connected.
- Policy event: shows the number of policy events that occur when a device control policy is triggered.
Note: The audit event to track media usage is enabled by default for devices onboarded to Microsoft Defender for Endpoint.
Understanding the audit events
The audit events include:
- USB drive mount and unmount: audit events are generated when a USB drive is mounted or unmounted.
- PnP: Plug and Play audit events are generated when removable storage, a printer, or Bluetooth media is connected.
- Removable Storage Access Control: events are generated when a Removable Storage Access Control policy is triggered; it can be Audit or Block or Allow. To learn more about Removable Storage Access Control, see our documentation: Microsoft Defender for Endpoint Device Control Removable Storage Access Control, removable storage media | Microsoft Docs.
Monitor device control security
Device control in Microsoft Defender for Endpoint empowers security administrators with tools that enable them to track their organization’s device control security through reports. You can find the device control report in the Microsoft 365 Security Center by going to Reports > Endpoints > Device control.
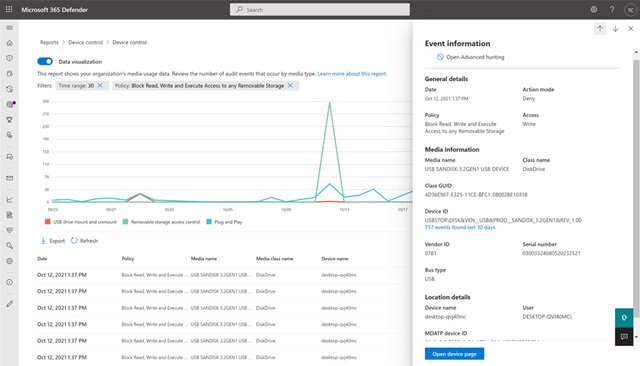
The device protection card on the Reports dashboard shows the number of audit events generated by media type, over the last 180 days.
The View details button shows more media usage data in the device control report page.
The page provides a dashboard with an aggregated number of events per type, and a list of events. Administrators can filter on time range, media class name, and device ID.
When you select an event, a flyout appears that shows you more information:
- General details: Date, Action mode, and the policy, and Access of this event
- Media information: Media information includes Media name, Class name, Class GUID, Device ID, Vendor ID, Serial number, Bus type.
- Location details: Device name, User, and .
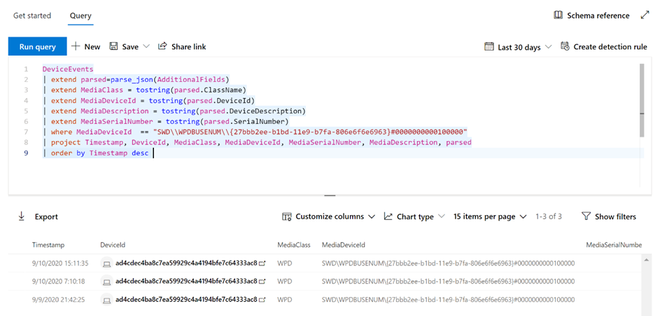
To see real time activity for this media across the organization, select the Open Advanced Hunting button. This includes an embedded, pre-defined query.
To see the security of the device, select the Open device page button on the flyout. This opens the device entity page.
For more information, see our documentation: Protect your organization's data with device control | Microsoft Docs.
Host firewall reporting in Microsoft Defender for Endpoint
The Firewall report is now generally available. This report is designed to show the activity and behavior of your devices configured with Windows host firewall.
About the firewall report
Administrators, you can now view host firewall reports in the Microsoft 365 Defender portal. This feature enables you to view Windows 10, Windows 11, Windows Server 2019, and Windows Server 2022 firewall reporting from a centralized location.
What do you need to know before you begin?
- You must be running Windows 10 or Windows 11, or Windows Server 2019, or Windows Server 2022.
- To onboard devices to the Microsoft Defender for Endpoint service, see here.
- For Microsoft 365 Defender portal to start receiving the data, you must enable Audit Events for Windows Defender Firewall with Advanced Security:
- Enable these events by using Group Policy Object Editor, Local Security Policy, or the auditpol.exe commands. For more information, see here.
- The two PowerShell commands are:
- auditpol /set /subcategory:"Filtering Platform Packet Drop" /failure:enable
- auditpol /set /subcategory:"Filtering Platform Connection" /failure:enable
-
Note: make sure to follow the instructions from the section above and properly configure your devices.
- After enabling the events, Microsoft 365 Defender will start to monitor the data.
- Remote IP, Remote Port, Local Port, Local IP, Computer Name, Process across inbound and outbound connections.
- Can now see Windows host firewall activity here.
- Additional reporting can be facilitated by downloading the Custom Reporting script to monitor the Windows Defender Firewall activities using Power BI.
- It can take up to 12 hours before the data is reflected.
- The two PowerShell commands are:
Firewall reporting
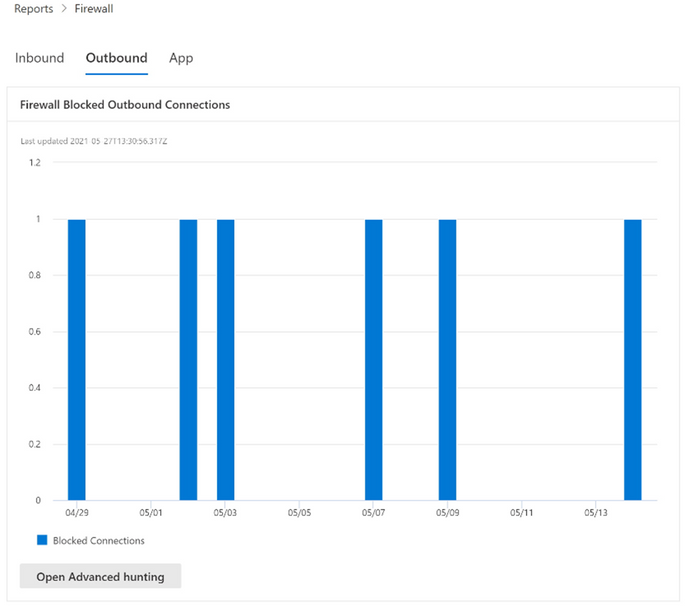
Below are several examples of the firewall report pages, which include a summary of inbound, outbound, and application activity. You can access this page directly by going to https://security.microsoft.com/firewall.
These reports can also be accessed by going to Reports > Security Report > Devices (section) located at the bottom of the Firewall Blocked Inbound Connections card.
Drill to Device Timeline
Cards support interactive objects. You can drill into the activity of a device by clicking on the device name, which will launch https://securitycenter.microsoft.com in a new tab, and take you directly to the Device Timeline tab.
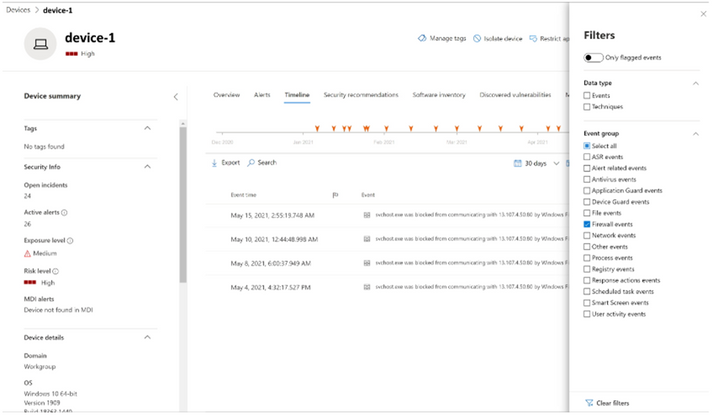
You can now select the Timeline tab, which will give you a list of events associated with that device.
After clicking on the Filters button on the upper right-hand corner of the viewing pane, select the type of event you want. In this case, select Firewall events and the pane will be filtered to Firewall events.
Drill into advanced hunting
Firewall reports support drilling from the card directly into Advanced Hunting by clicking the Open Advanced hunting button. The query will be pre-populated.
The query can now be executed, and all related Firewall events from the last 30 days can be explored.
For additional reporting, or custom changes, the query can be exported into Power BI for further analysis. Custom reporting can be facilitated by downloading the Custom Reporting script to monitor the Windows Defender Firewall activities using Power BI.
Microsoft Defender for Endpoint is an industry-leading, cloud-powered endpoint security solution offering vulnerability management, endpoint protection, endpoint detection and response, and mobile threat defense in a single unified platform. With our solution, threats are no match. If you are not yet taking advantage of Microsoft’s unrivaled threat optics and proven capabilities, sign up for a free trial of Microsoft Defender for Endpoint today.
Microsoft Defender for Endpoint team
Posted at https://sl.advdat.com/3L4Nlalhttps://sl.advdat.com/3L4Nlal
