In collaboration with Henry Liu and Rohitha Hewawasam
Intro
We are starting a series of blog posts to benchmark common Logic App patterns.
For the first post is in the series, we will be looking at an asynchronous burst load. In this scenario an HTTP request with a batch of messages (up to 100k) invokes a process that fans out and processes the messages in parallel. It is based on a real-life scenario, implemented by one of our enterprise customers, who was kind enough to allow us to use it to benchmark various performance characteristics of Logic Apps Standard across WS1, WS2, and WS3 plans.
Workflows
The scenario is implemented using a single Logic App Standard App, which contains two workflows:
- Dispatcher – a stateful workflow using an HTTP trigger with SplitOn configured. It receives an array of messages in the request body to split on, and for each message, it invokes a stateless child workflow (Enricher)
- Enricher – A stateless workflow used for data processing. It contains data composition, data manipulation with inline JavaScript, outbound HTTP calls to a Function App, and various control statements.
Having the parent workflow as a stateful facilitates scaling out to multiple instances and distributing parent workflow runs across them. Having the data processing workflow as stateless allows messages to be processed with lower latency while achieving higher throughput.
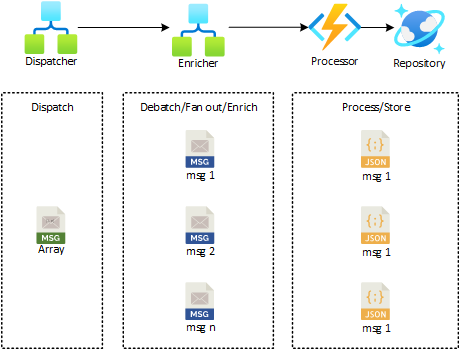
The diagram below represents the scenario at a conceptual level:
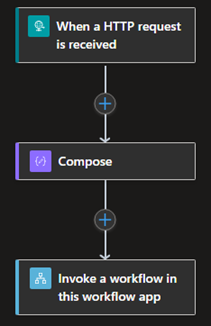
You can see the details of each logic app implementation in the diagrams below:

Results
The diagrams below represent a series of metrics collated to understand the performance of each Logic Apps Standard app service Plan. You should be able to reproduce those results by following the instructions on github repository, collating your own benchmark measurements from Application Insights. Some notes:
- Sending telemetry to App Insights incurs in a performance penalty. As we wanted to take the most out of the app service plans, the data collated below were gathered with App Insights disabled, using internal telemetry. So, your collated data might vary slightly. For more information on how to run queries and analyze your own data, take a look at the series of Kusto queries available in the read.me file of the github repository.
- The Logic App Standard implementation has the default scale out settings enabled, so the data below reflects auto-scaling from the application.
Execution Elapsed Time
The chart below represents the total time take to process a batch of 40k and 100k messages, respectively, when using a WS1, WS2 and WS3 app service plan:

Scaling profile
The scaling profile shows how each app service plan scaled overtime to meet the workload burst, using the default settings for elastic scale.
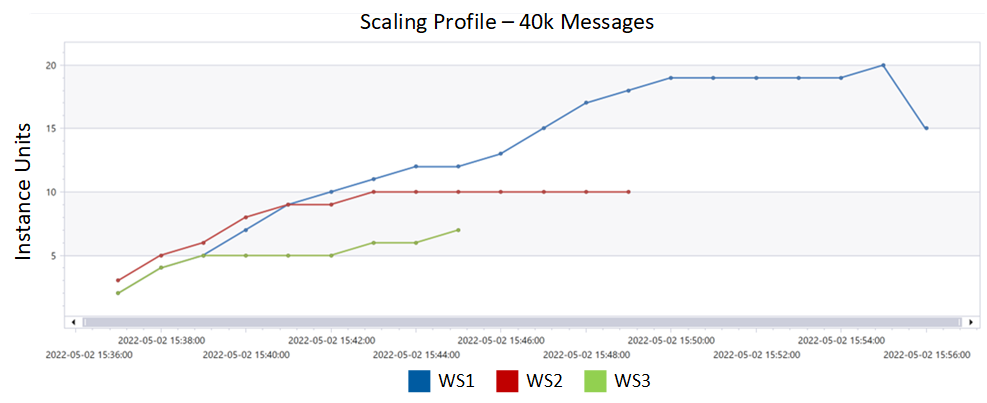

The diagram below shows some interesting points:
- In both cases, the scaling engine responds quite quickly to the increase in load, adding more machines to support the load.
- The number of instances is proportional to the size of each instance and relatively linear between them. This is expected, as both CPU and memory grows proportionally between plans (WS3 is two time the compute of WS2, which is two times the compute of WS1).
- Compared to Integration Services Environment, the scaling for Logic Apps Standard happens much faster, as there we are dealing with smaller instances that can be spun much faster. The same can be said to scaling back in.
The table below shows the peak and average instance counts for each plan, to meet the 40k and 100k workloads, respectively:
|
Instance Type |
40k Messages Workload |
100k Messages Workload |
||
|
# instances (avg) |
# instances (peak) |
# instances (avg) |
# instances (peak) |
|
|
WS1 |
13.3 |
20 |
18.6 |
27 |
|
WS2 |
8.5 |
10 |
12.4 |
18 |
|
WS3 |
5 |
7 |
7.5 |
13 |
Execution Throughput
When it comes to execution throughput, we can analyze it from two points of view:
- Actions execution throughput
- Workflow execution throughput
We decided to focus on actions execution throughput, which might help you understand the throughput that would be applied to your own workflow, as it can be quite different in terms of complexity from the example presented. For completeness, we will include queries to calculate workflow executions later.
The table below represents the number of actions executed in total for each burst workload, and per workflow execution. This should allow you to analyze throughput and draw comparisons with your own scenarios and workloads.
|
Workflow type |
# Actions (40k messages) |
# Actions (100k messages) |
||
|
Total |
Per Execution |
Total |
Per Execution |
|
|
Dispatcher (stateful) |
80000 |
2 |
200000 |
2 |
|
Enricher (stateless) |
1080000 |
27 |
2700000 |
27 |
The set of diagrams below action execution throughput, highlighting peak, average and progress overtime:


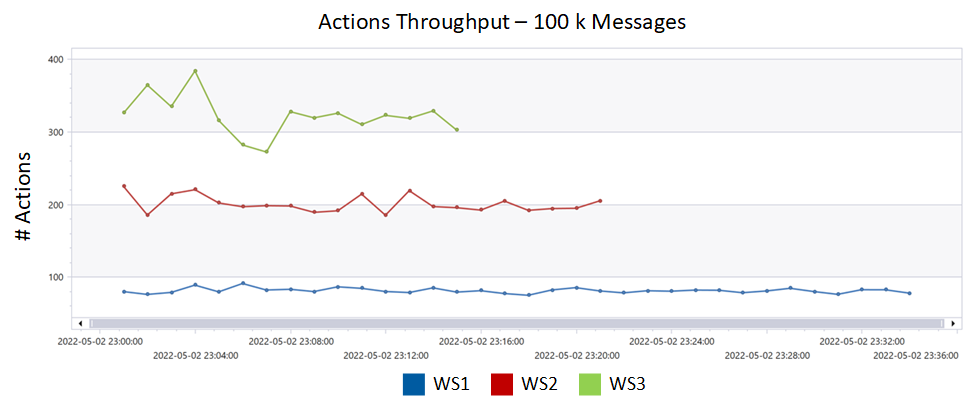
One more time, as app service plans grows, throughput increases proportionally, for both peak and averages.
Execution Delay (95th percentile)
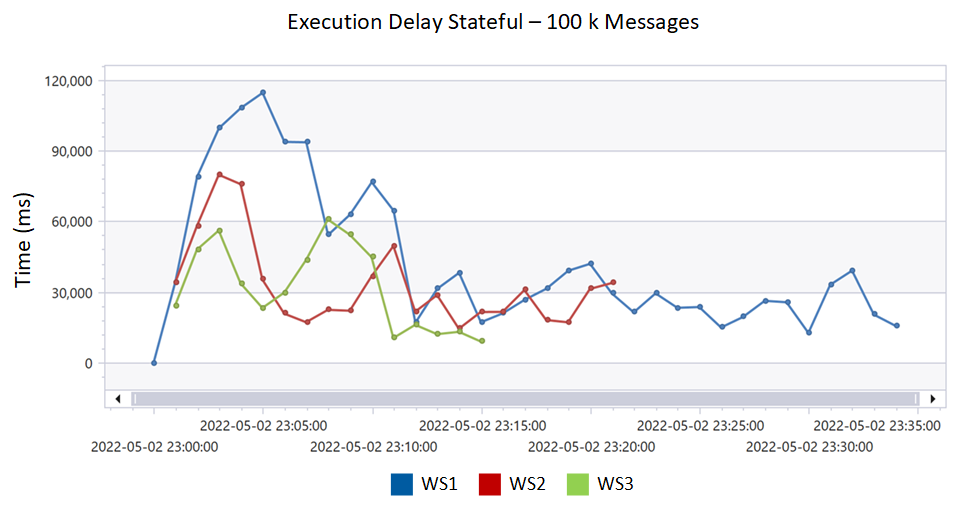
Execution delay is the measure of when a job is scheduled to be executed versus when it was actually executed. It is important to note that this value will never be zero, but a higher execution delay indicates that system resources are busy and jobs have to wait longer before they can be executed.
Execution Delay - Stateful Workflows

Execution Delay - Stateless Workflows


Execution delay is the time difference between when an action is scheduled to be executed and when it actually executed. An execution delay of 200ms or less is optimal. Higher execution delay means that current system resources are at capacity and scaling out is needed.
Another point to notice in the graphics above is how much the execution delay is improved when using Stateless workflows, compared to Stateful workflows.
CPU and Memory Utilization
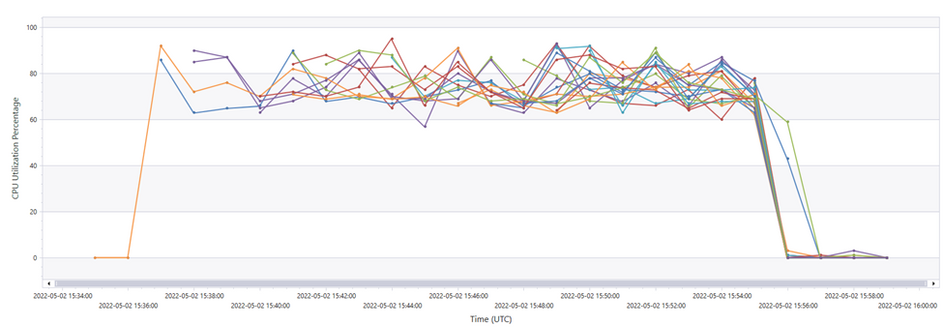
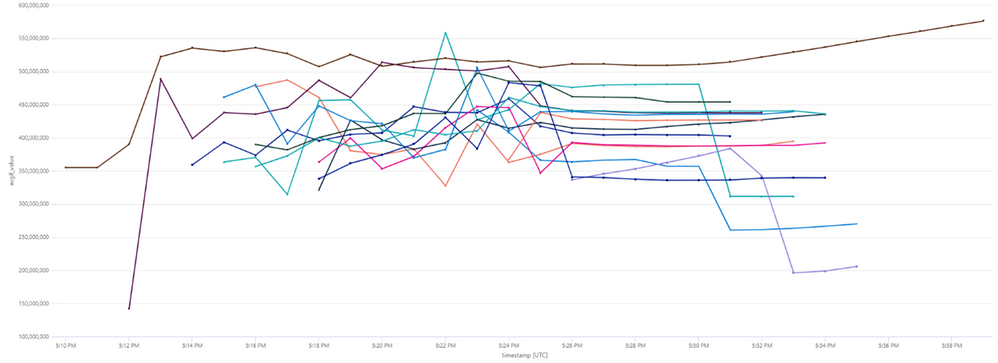
The diagrams below present the CPU and memory utilization for each instance added to support the workload, in each on of the App Service Plans. The default scaling configuration will try to keep CPU utilization between 60% and 90%, as under 60% would indicate that the instance is under utilized, and 90% would indicate that the instance is under stress, leading to performance degradation. As usually CPU becomes a bottleneck much faster than memory, there is no default scaling for memory utilization. This can be confirmed by the data below.
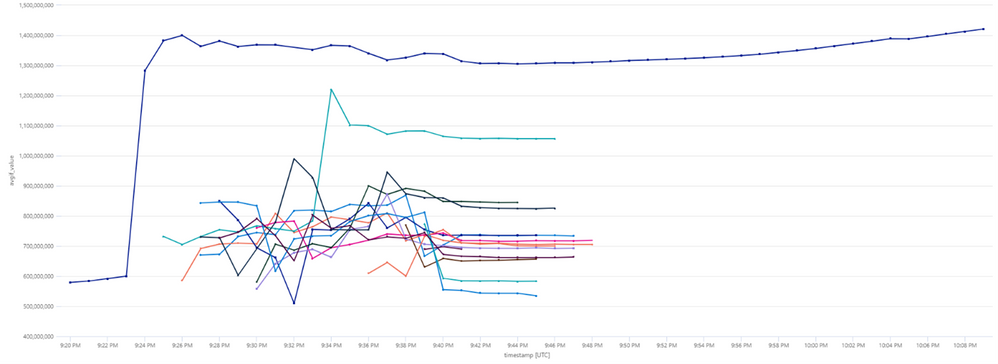
90th Percentile CPU Percentage Utilization - 40K Messages Workload


Average Memory Utilization (in Bytes) - 40K Message Workload

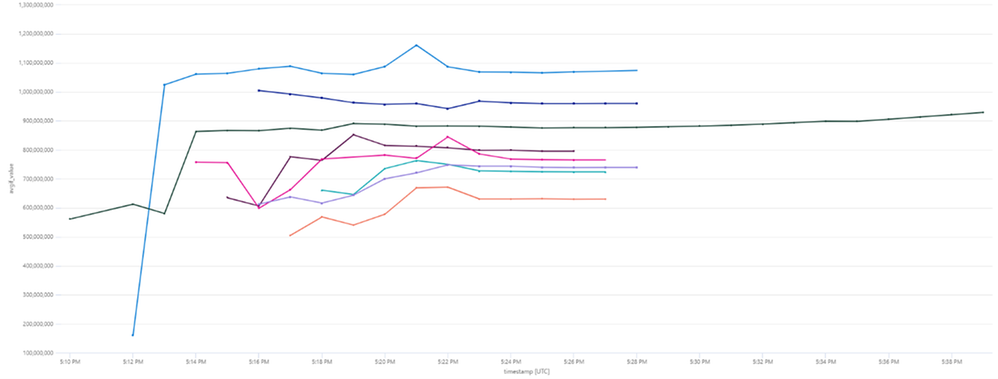
90th Percentile CPU Utilization - 100K Messages Workload
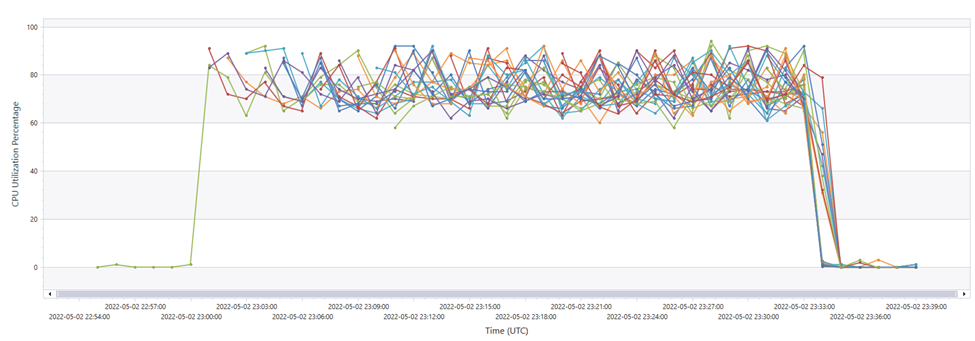


Average Memory Utilization (in Bytes) - 100K Message Workload


