This article is the second part of a series (part 1) which explores an end-to-end pipeline to deploy an Air Quality Monitoring application using off-the-shelf sensors, Azure IoT Ecosystem and Python. In the previous article we explored why such a platform is useful and how to solve the first mile problem of building this platform, i.e. getting the sensor data to the cloud. Before beginning this article it is assumed that you understand the impact of the product and it's potential value in current times, met the prerequisites, and successfully deployed the AirQualityModule on the IoT edge device. This article will show how to consume the data from the IoT hub, clean, summarize, and display the metrics on a dashboard.
What are ASA and Power BI?
Azure Stream Analytics (ASA) is an easy-to-use, real-time analytics service that is designed for mission-critical workloads. Power BI is the visualization layer that unifies data from many sources and provides insights. Refer to ASA and Power BI for pricing and documentation.
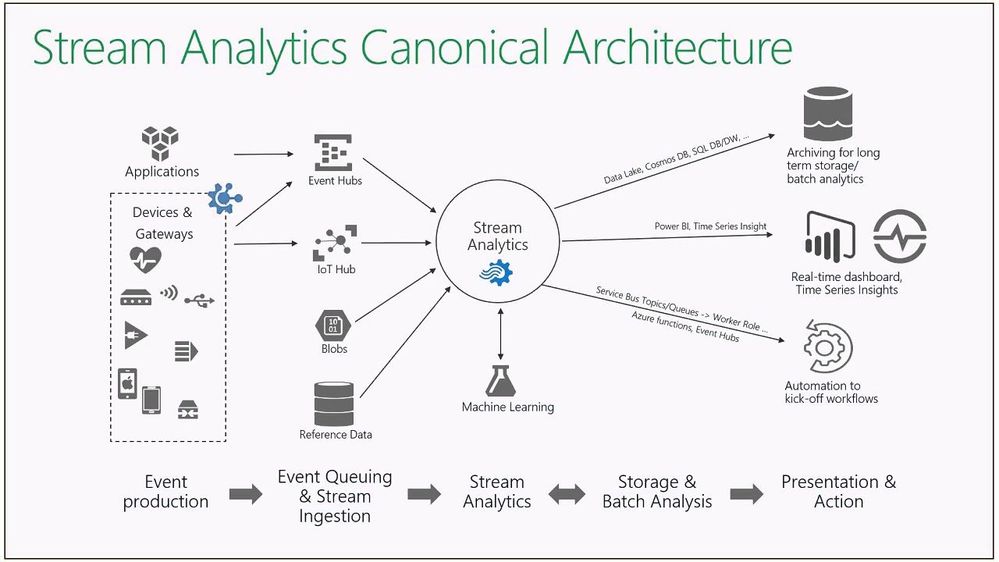
To really appreciate the Azure infrastructure, let us take a small step back and understand what it means to say 'Data is the new Oil'. What does Oil (Data) exactly do? It enables businesses to move faster, create actionable insights faster, and stay ahead of the competition. For obvious reasons, the business needs the pipelines taking Oil (Data) from production to consumption in a smooth and regulated way. The problem is that this seemingly 'smooth' process is a complex labyrinth of interwoven Oil (Data) Engineering pipelines that can potentially make or break the business. This means you have to be very careful and judicious when you choose your Oil (Data) Engineering tools for your clients. I experimented with a lot of products, and found ASA and Power BI to be best in class for real time data processing and visualization. Here is a diagramatic view of ASA's capabilities and its place in the Azure Ecosystem.
Some other notable mentions are Druid with Superset, InfluxDB/Azure Data Explorer (here) with Grafana, or even Cosmos DB (here) with React app. The deep integration of ASA and Power BI with the IoT ecosystem, and the ease of scaling with SLA are simply unbeatable in terms of turn-around time for the client. I highly recommend to use these products.
Preparing to consume
Here is the reference architecture for our current platform taken from part 1 of the series.
The data generated in the AirQualityModule uses message ROUTE mentioned in the IoT edge deployment. In a practical setting, this will almost never be the only module running on the edge device. More than one module could be sending data upstream to the IoT hub. For example here are the routes in my deployment. Notice the '$upstream' identifier. Refer here.
        "routes": {
          "AVAToHub": "FROM /messages/modules/avaedge/outputs/* INTO $upstream",
          "AirQualityModuleToIoTHub": "FROM /messages/modules/AirQualityModule/outputs/airquality INTO $upstream",
          "FaceDetectorToIoTHub": "FROM /messages/modules/FaceDetector/outputs/* INTO $upstream"
        }
Here I have an object detector module running alongside, sending inference data to the same IoT hub. Thus my IoT hub is receiving both these events.
[{
    "temperature": 26.11,
    "pressure": 1003.76,
    "humidity": 39.26,
    "gasResistance": 274210,
    "IAQ": 129.1,
    "iaqAccuracy": 1,
    "eqCO2": 742.22,
    "eqBreathVOC": 1.05,
    "sensorId": "roomAQSensor",
    "longitude": -79.02527,
    "latitude": 43.857989,
    "cpuTemperature": 27.8,
    "timeCreated": "2021-07-20 04:11:23",
    "EventProcessedUtcTime": "2021-07-20T05:09:32.7707113Z",
    "PartitionId": 1,
    "EventEnqueuedUtcTime": "2021-07-20T04:11:23.5100000Z",
    "IoTHub": {
      "MessageId": null,
      "CorrelationId": null,
      "ConnectionDeviceId": "azureiotedge",
      "ConnectionDeviceGenerationId": "637614793098722945",
      "EnqueuedTime": "2021-07-20T04:11:23.5150000Z",
      "StreamId": null
    }
  },
  {
    "timestamp": 146407885400877,
    "inferences": [
      {
        "type": "entity",
        "subtype": "vehicleDetection",
        "entity": {
          "tag": {
            "value": "vehicle",
            "confidence": 0.57830006
          },
          "box": {
            "l": 0.34658492,
            "t": 0.6101173,
            "w": 0.047571957,
            "h": 0.040370107
          }
        }
      }
    ],
    "EventProcessedUtcTime": "2021-07-20T05:09:32.7707113Z",
    "PartitionId": 1,
    "EventEnqueuedUtcTime": "2021-07-20T04:11:22.8320000Z",
    "IoTHub": {
      "MessageId": "4f12572a-aa87-4d87-b46f-ebd658ec3d8f",
      "CorrelationId": null,
      "ConnectionDeviceId": "azureiotedge",
      "ConnectionDeviceGenerationId": "637599997588483809",
      "EnqueuedTime": "2021-07-20T04:11:22.8400000Z",
      "StreamId": null
    }
  }
]
Notice that the two blocks have totally different structures. Similarly there can be many more, and whatever data layer you create on top of this must cater to the dynamic and asynchronous nature of the input. This is where ASA shines and we will see how.
Real time IoT hub data processing with ASA
Processing data real time is never easy, no matter what tool we use. Fortunately Azure has provided us with common solution patterns and best practices regarding ASA here. You have a few good options depending on what you are comfortable with.
- Process the data using an ASA job as a UDF in C# (here)
- Process the data using Azure functions which can be in Python (here)
- Process the data using ASA Streaming Query Language (here)
You can add optional layers of RDBMS/Big Data/NoSql to persist the data, but for our current activity one of the above 3 is fine. My choice was the 3rd option since the resultant pipeline remains lightweight, and ASA SQL is just so powerful!
Before we move on here are the sequence of steps you need to follow to implement this successfully.
- Check the IoT hub endpoint for messages from AirQualityModule
- Create ASA cloud job following the guides here and here
- Configure IoT Hub as input with JSON format
- Configure output to send to Power BI dashboard
- Create Query using temporary resultset and window functions
- Save the query and test using ASA interface
- Start the job to set it to running state
- Monitor ASA job for resource utilization
- Go to Power BI screen and check ASA output in workspace
- Create dashboard displaying Air Quality metrics
- Share Power BI dashboard with end user
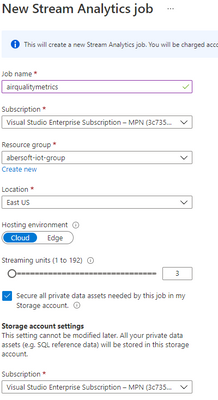
Let us go through the steps in details. Step 1 you can check using VSCode to consume the endpoint option within the IoT tools extension. The required output is part of the two json outputs shown above. We will see how to separate those two soon. For step 2 you can create an ASA job through the portal or marketplace. You can automate this, but the portal is enough for our purpose. Call it anything you want (airqualitymetrics), use the 'cloud' option (important) and 3 streaming units (SUs). Technically you can do with less, but its a good habit to keep some buffer.
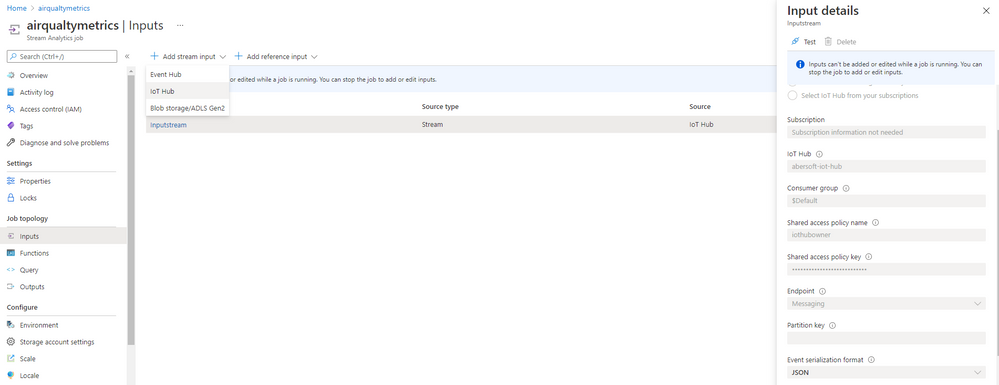
For steps 3 you can configure the IoT hub option. Notice the serialization format is set to 'JSON'. Clicking on 'Test' should say 'succeeded' a bit later.
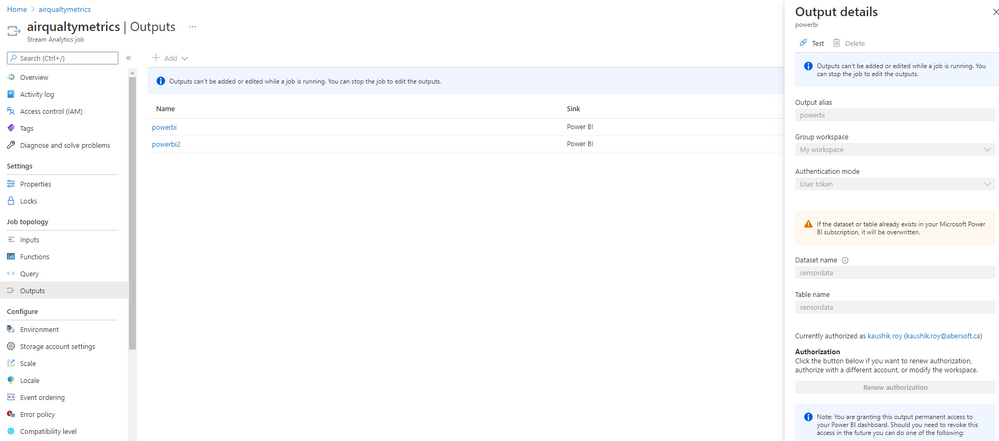
For step 4 you can have as many outputs as you want, at least one of which should be Power BI. Put in the appropriate workspace and dataset name. 'Test' it. This output name 'sensordata' is how it will appear in your Power BI app when you log into it.
Step 5 is where all the magic happens. With one compact ASA query shown below you can accomplish the following tasks:
- Create a temporary result for your air quality metrics (or other modules)
- Apply data cleaning/sanitization/aliasing to the values inside
- Compress high frequency data using tumbling window of 30 seconds
- Create final outputs from querying temporary results
WITH
AirQuality AS (
SELECT
    sensorId
    ,System.Timestamp() AS OutTime
    ,ROUND(AVG(temperature),2) as temperature
    ,ROUND(AVG(pressure),2)  as pressure
    ,ROUND(AVG(humidity),2)  as humidity
    ,ROUND(AVG(gasResistance),2)  as gasResistance
    ,ROUND(AVG(IAQ),2)  as IAQ
    ,ROUND(AVG(iaqAccuracy),2)  as iaqAccuracy
    ,ROUND(AVG(eqCO2),2)  as eqCO2
    ,ROUND(AVG(eqBreathVOC),2)  as eqBreathVOC
    ,ROUND(AVG(cpuTemperature),2)  as cpuTemperature
    ,MAX(longitude) as longitude
    ,MAX(latitude) as latitude
FROM
    Inputstream TIMESTAMP BY IoTHub.EnqueuedTime
WHERE
    sensorId is not null
GROUP BY sensorId,TumblingWindow(second,30)
)
,Faces AS (
select IoTHub.ConnectionDeviceId,
IoTHub.EnqueuedTime AS OutTime,
GetArrayElement(inferences,0).subtype,
GetArrayElement(inferences,0).entity.tag.value,
GetArrayElement(inferences,0).entity.tag.confidence,
GetArrayElement(inferences,0).entity.box.l,
GetArrayElement(inferences,0).entity.box.t,
GetArrayElement(inferences,0).entity.box.w,
GetArrayElement(inferences,0).entity.box.h
from Inputstream timestamp by IoTHub.EnqueuedTime
where timestamp is not null)

SELECT * into powerbi2 from Faces where confidence>0.60
SELECT * into powerbi from AirQuality
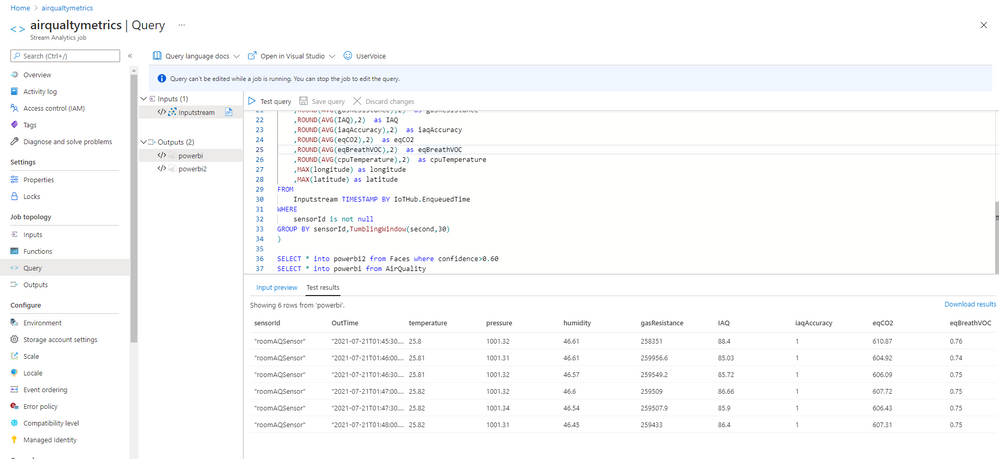
If you followed all the steps correctly you should get data from the live stream in a 'Table' or 'Raw' format. Click on 'Save Query' to save and then 'Test Query' to actually run the above query on the live data. If all goes well you should get back test results as below.
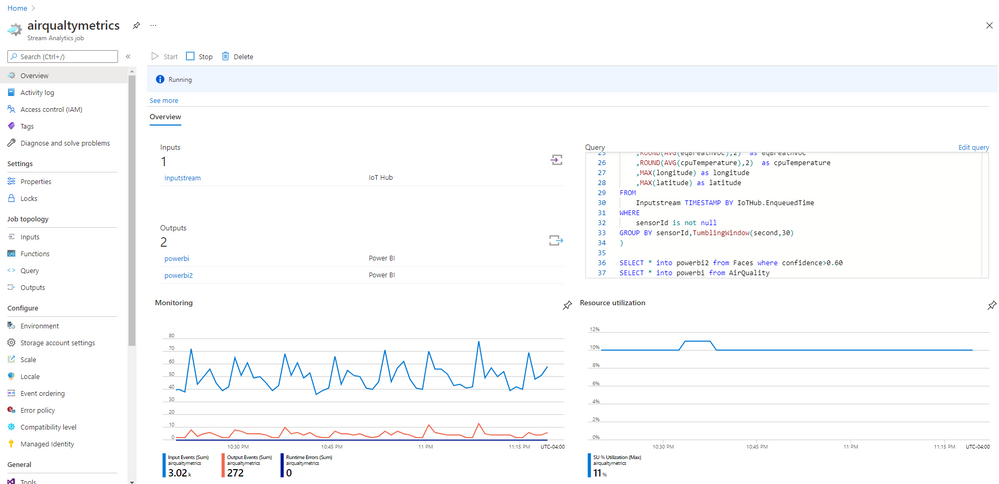
Go back to the 'Overview' blade and click on 'Start' to start the job. Monitor the job for a couple of hours and you should can see the job state 'Running' and the utilization on the screen. This completes step 7 and 8.
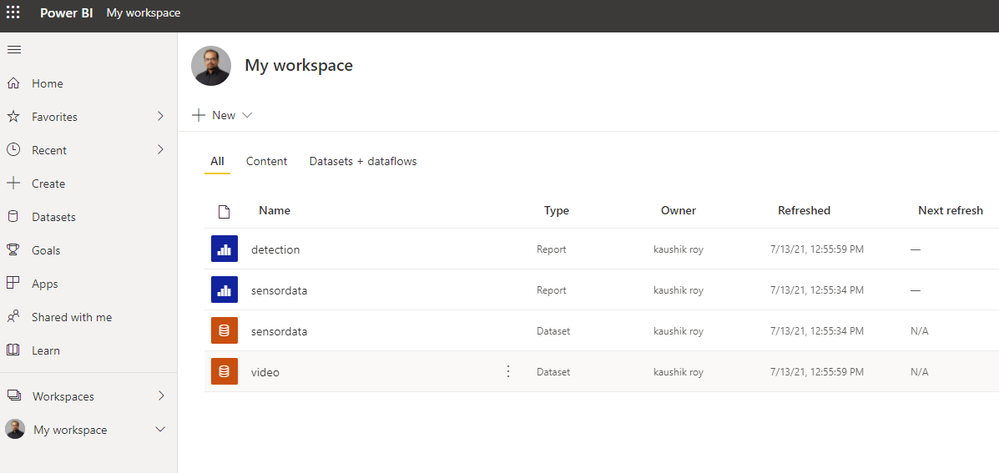
After this go to the Power BI application and click on 'My Workspace'. If the ASA job is running then you will see the outputs as a 'Dataset' in your workspace. Note: If you don't see the output most probably the cause is the ASA job is not in a 'Running' state.
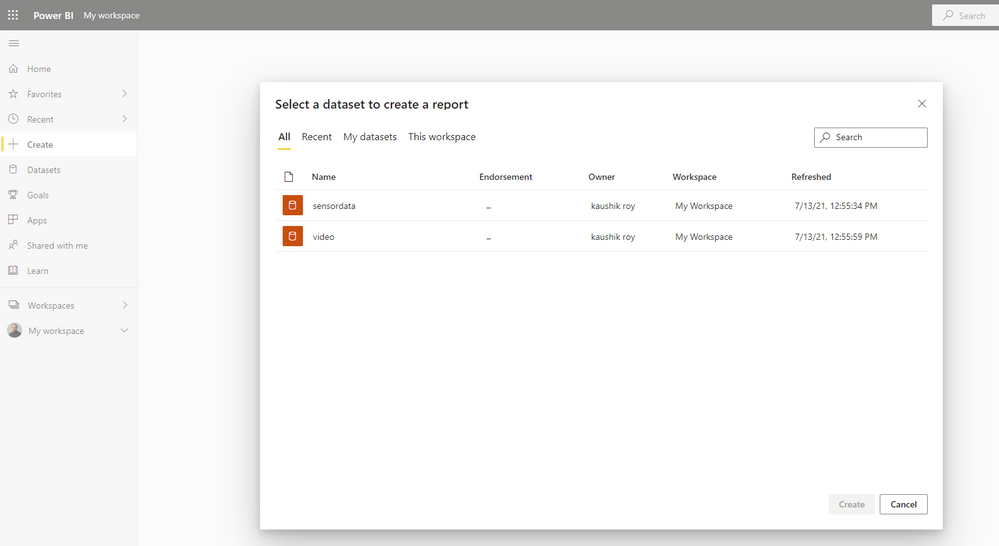
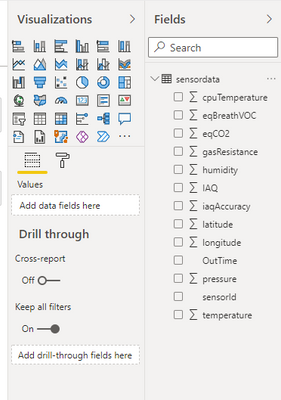
Click on 'Create' to start a dashboard and use a 'Published Dataset'. Here you can choose the 'sensordata' source. Remember this is configured in the ASA powerbi output in step 4. Step 9 is done.
Drag and drop a bunch of line charts from the vizualizations menu and click the appropriate checkboxes. Use the time axis to plot the values. Click on 'Save' to complete step 10.
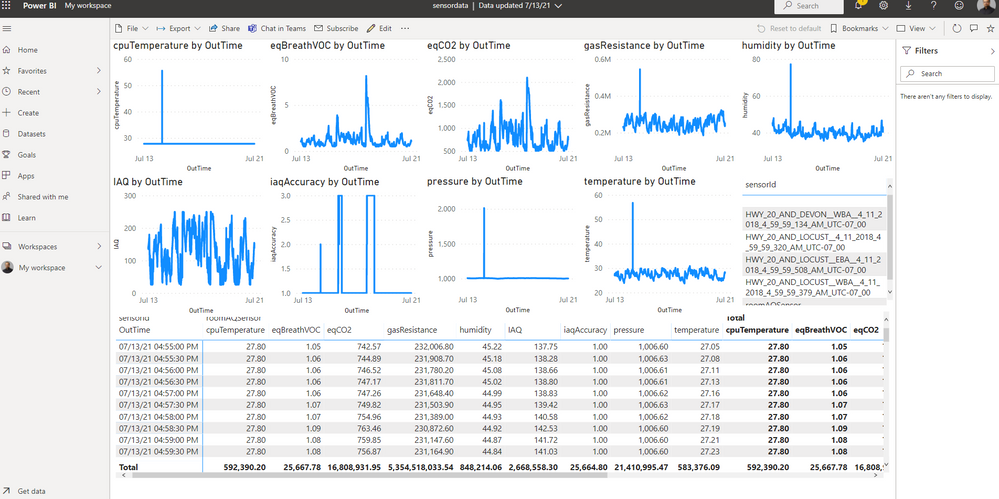
Finally after all that effort we have the product ready for the end user! Just click on 'Share' and you have completed a production-ready scable end-to-end solution to display live air quality metrics using a simple off-the-market sensor and Azure IoT ecosystem. Here is how my final dashboard looks.
Future Work
I hope you enjoyed this series of articles on a complete AIr Quality monitoring application. We love to share our experiences and get feedback from the community as to how we are doing. Look out for upcoming articles and have a great time with Microsoft Azure.
To learn more about Microsoft apps and services, contact us at contact@abersoft.ca or 1-833-455-1850!
Please follow us here for regular updates: https://lnkd.in/gG9e4GD and check out our website https://abersoft.ca/ for more information!
Posted at https://sl.advdat.com/3izw6Rz
