What is PMM?
Percona Monitoring and Management (PMM) is a best-of-breed open-source database monitoring solution. PMM helps you to reduce complexity, optimize performance, and improve the security of your business-critical database environments, no matter where they’re located.
You can use PMM to monitor Azure MySQL database instances just as you can other remote MySQL instances. In this case, rather than having the PMM client installed on the host where the database server is deployed, you use the PMM web interface to connect to the instance. While Discovery is not yet implemented in the production version, you can still use PMM with known instances by providing the appropriate connection parameters.
In version 2.16.0, PMM provides Technical preview support for Azure Discovery and Node metrics extraction for both Microsoft Azure Database for MySQL and PostgreSQL. If you enable the Technical Preview for Azure Monitoring functionality, you can easily discover and add Azure databases to monitor, including node-level monitoring.
Note: This Technical Preview functionality should become final after Percona collects enough user feedback. Percona plans to do more work on this PMM feature to make it more API and resource efficient.
In this post, you’ll learn how to:
- Run PMM Server with Docker based on PMM Docker image.
- Access the Administration Portal.
- Enable the Azure Monitoring Technical Preview.
- Discover Azure resources.
- Add Azure Database for MySQL (Flexible and Single Server) instances to PMM with and without using the Azure Discovery functionality.
Prerequisites
Before you begin the steps in this post, ensure that you have created an:
- Azure VM running Linux (preferably Ubuntu) by using the Azure portal.
- Instance of Azure Database for MySQL - Flexible Server or an instance of Azure Database for MySQL - Single Server.
- App registration in your Azure Active Directory, as well as a client secret.
Important: When you create the client secret, be sure to copy and store the values in a safe place, as they can't be retrieved again. If you can't find them later, you'll have to create a new secret.
In addition, for the app you’ve registered:
- Note the client tenant id and client ID.
- Ensure that it has contributor permission for your subscription; also note of subscription ID.
Note: Be sure to capture the following details, which you'll be required to use later in this post: Client ID, Client Secret, Tenant ID, and Subscription ID.
Run PMM as a Docker container
There are multiple ways to install the PMM client on a node and register it with PMM server. The preferred method of installing the PMM client on a node and registering it with the PMM server is to use Docker. Docker images of PMM server are stored in the percona/pmm-server public repository. Note that the host requires network access and must be capable of running Docker 1.12.6 or later.
To run the PMM as a Docker container, perform the following steps:
- Sign in to the Azure Linux VM with the Secure Shell (SSH) tool using the public IP for the VM.
- To install Docker, run the following commands:
For more details, see Install Docker Engine on Ubuntu.$ sudo apt-get update $ sudo apt-get install docker-ce docker-ce-cli containerd.io - To pull the image, run the following command:
$ sudo docker pull percona/pmm-server:2 - To create a persistent data container, run the following command:
Important: PMM server expects the data volume to be /srv. Using any other value will result in data loss when upgrading.$ sudo docker create --volume /srv \ --name pmm-data \ percona/pmm-server:2 /bin/true - To check server and data container mount points, run the following command:
$ sudo inspect pmm-data |grep Destination &&\ docker inspect pmm-server |grep Destination - To run the image, run the following command:
$ sudo docker run --detach --restart always \ --publush 80:80 --publish 443:443 \ --volumes-from pmm-data \ --name pmm-server \ percona/pmm-server:2 - To test the installation, run the following command:
$ sudo docker exec -it pmm-server curl -u admin:admin http://localhost/v1/versionYou should receive output similar to that shown below.
{
  "version": "2.19.0",
  "server": {
    "version": "2.19.0",
    "full_version": "2.19.0-59.2106301054.58b0b89.el7",
    "timestamp": "2021-06-30T10:54:26Z"
  },
  "managed": {
    "version": "2.19.0",
    "full_version": "<GUID>",
    "timestamp": "2021-06-15T16:44:37Z"
  },
  "distribution_method": "DOCKER"
Note: If you need to stop or start the PMM docker container, you can use the following commands:
$ Stop the container: $ docker stop pmm-server

$ Start the container: $ docker start pmm-server
Access the Administration portal
To access the Administration portal, perform the following steps:
- Open your browser, and then navigate to http://<Public_IP_of_VM>.
- Sign in to the portal by using the following user credentials
User Name: Admin
Password: Admin
- When prompted to change the password, update the password to a value of your choosing.
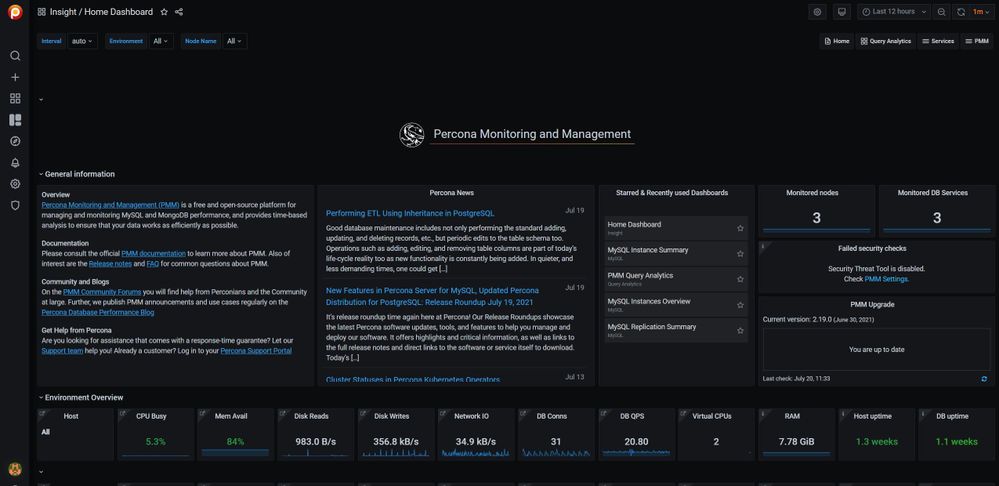
- Sign in to the portal using the new credentials.
The Administration portal appears, as shown in the following diagram.
Enable Azure monitoring Technical Preview
The Discovery functionality isn’t available to users unless the Technical preview feature has been explicitly enabled on the PMM Settings page.
To enable Azure monitoring Technical Preview, perform the following steps:
- In the Administration portal, in the left pane, select Configuration, and then select Settings.
- From the Settings menu, select Advanced Settings.
- Under Technical preview features, turn on Microsoft Azure monitoring, and then select Apply changes.
Note: Disabling the feature after it has been enabled doesn’t remove services that have already been specified for monitoring. However, users will no longer have the ability to use Discovery to add new Microsoft Azure service.
Discover Azure resources
To discover Azure resources, perform the following steps:
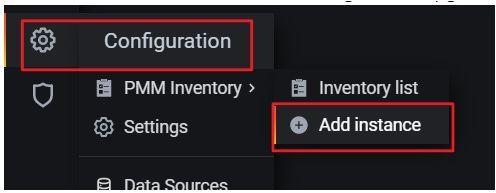
- In the portal, select Configuration, and then select Add instance.
- Select the icon labeled Microsoft Azure MySQL or PostgreSQL Add a remote instance.
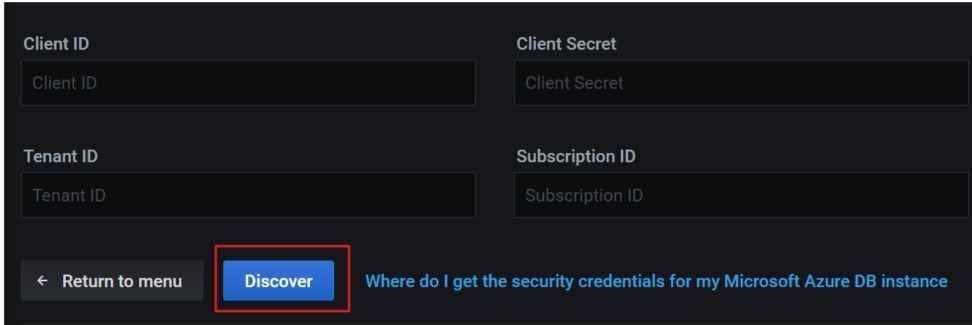
- Using the details that you collected as directed in the Prerequisites section above, complete the Client ID, Client Secret, Tenant ID, and Subscription ID text boxes, and then select Discover.
PMM now discovers and lists all the resources.
Tip: If the discovery fails with Access Denied errors, verify that the App ID you’ve specified has the contributor permission.
Note: As of this writing, there’s a problem with discovery. I’ve filed a related issue ([PMM-8435] When we select a subscription which does not have any service it fails with unexpected error - Percona JIRA). Vote for\add watcher for this item for notification know when the issue is fixed.
4. To monitor a specific resource identified in the list, under the Action heading, select Start monitoring.
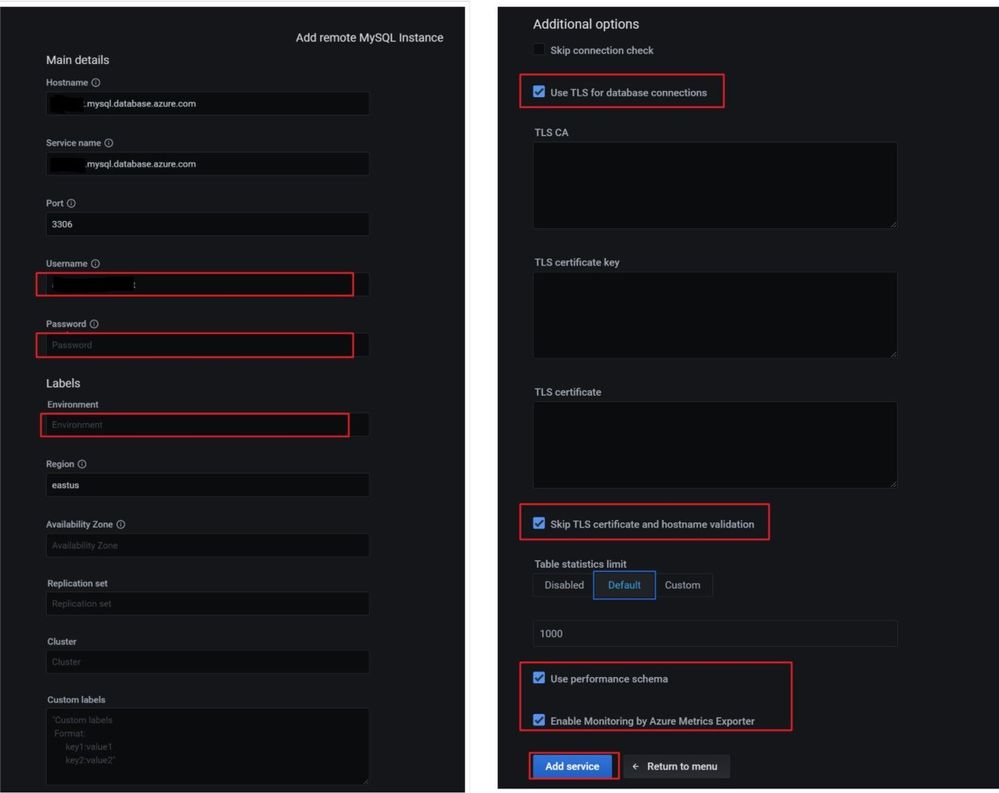
5. Use the following information to complete the page.
Username: Name of a user with access to the Azure Database for MySQL server.
Note: Currently, the page populates the Username field with username@servername for both Azure Database for Single and Flexible Server. For Flexible Server, you only need to include the username (not the @servername). To have this resolved, I’ve submitted to Percona the following issue: [PMM-8437] For flexible server it is using user name as @servername - Percona JIRA. Vote for\add watcher for this item for notification know when the issue is fixed.
Password: Password.
Environment: Provide descriptive text to help you identify and categorize the service you want to monitor.
6. Select the Use TLS for database connections check box (you don’t need to specify the TLS CA, key, or certificate).
7. Select the Skip TLS certificate and hostname validation check box.
The Use performance Scheme and Enable Monitoring by Azure Metric Explorer check boxes are selected by default.
8. With the page fully populated, select Add service.
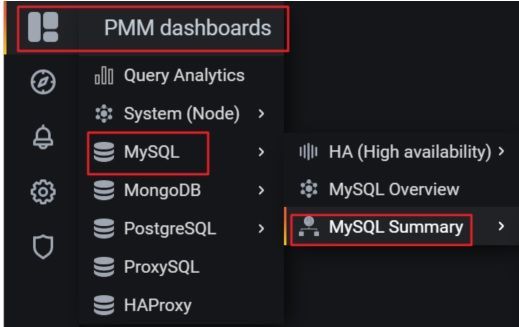
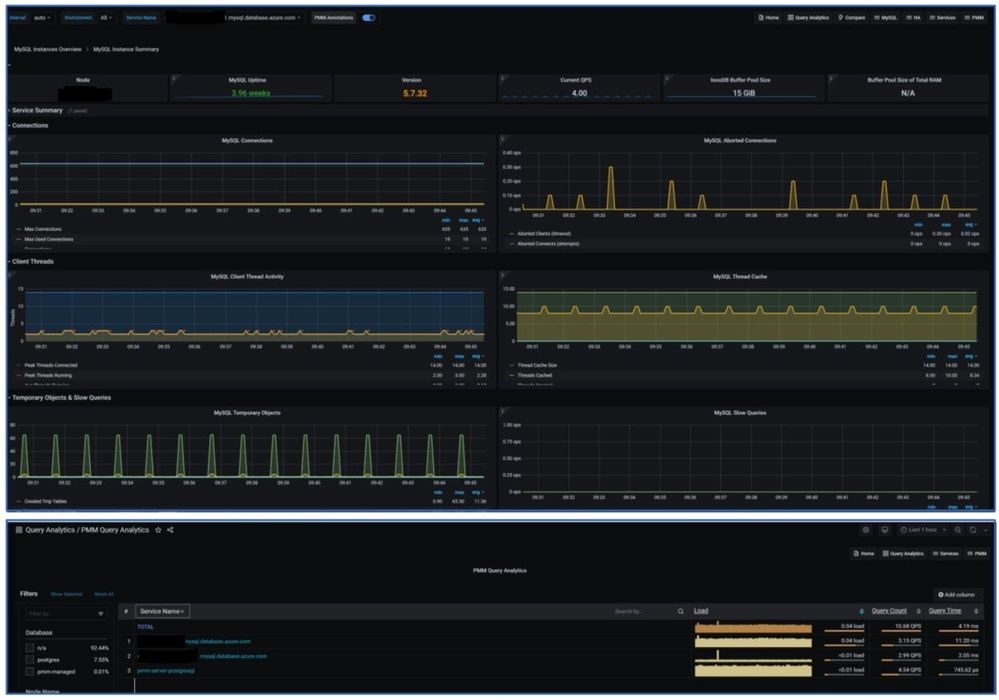
9. To view the dashboard, in the left pane, select PMM dashboards, select MySQL, and then select MySQL Summary.
You can now explore the different dashboard views. Below are a few sample screenshots for reference.
Add an Azure Database for MySQL instance to PMM without using Azure Discovery
If you’d rather monitor an Azure Database for MySQL instance using the production build of PMM without the Azure Discovery functionality, perform the following steps.
- In the Administration portal, in the left pane, select Configuration, and then select Add instance.
- Select the icon labeled MySQL Add a remote instance.
- Provide the details as shown previously, and then select Add service.
Conclusion
This completes my post. You should now be able to run PMM Server as a Docker container, access the Administration Portal and enable the Azure monitoring Technical Preview, discover Azure resources, and add instances of Azure Database for MySQL to monitor using PMM.
For more details on how to use PMM to monitor Azure databases, see the following resources:
- Percona Monitoring and Management
- PMM for Monitoring Azure Databases
- Percona and Microsoft Azure Partnership
