Hi all,
I’m Edoardo, and I work in Microsoft as a Customer Engineer, where I’m focused on Azure Monitor and Azure Infrastructure.
The idea of this article was born during a delivery, when a customer asked me if it was possible to manipulate Logs data as Metrics. In this article we will discover, Why this is a good question and What are the key benefits of this choice.
Metrics VS Logs
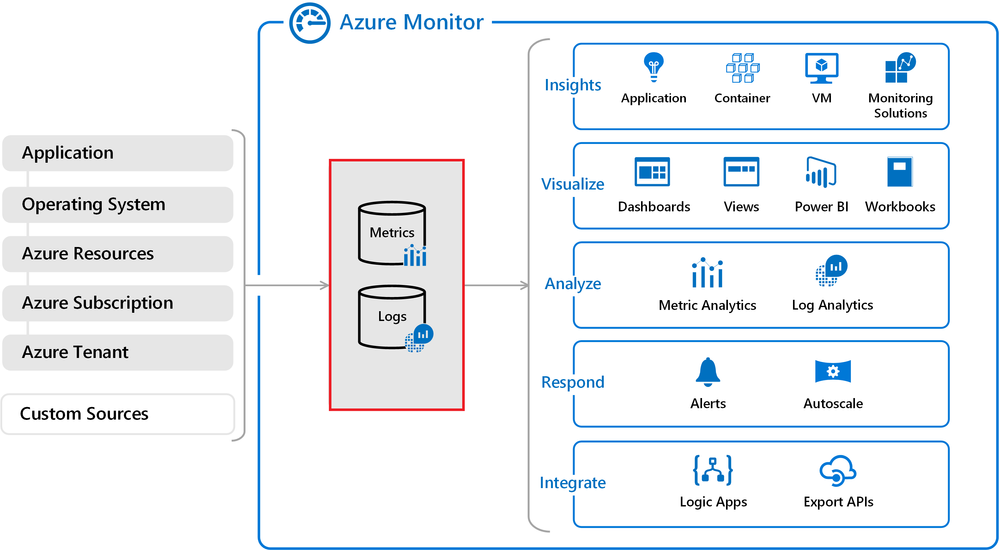
Metrics and Logs are the second steps of our journey in Azure Monitor

Azure Metrics are basically numeric values, representing the resource status at certain moment, for example the CPU for a VM or a number of webapp’s HTTP requests. They are very useful for a Boolean logic and they support Dynamics threshold (you don’t need to define a threshold, Azure with AI technology can define a threshold using the history of the Metric).
Azure Logs are basically structured data and can be captured from different sources and with those records we can do many activities, represent data, create estimations or create alerts. You can create an alert using a query and trigger the alert using the results of the query, in particular the number of results. The plasticity of these alerts are in the power of the Kusto Query Language.
So the reason we need to convert Logs data to Metrics, is basically for 3 reasons :
- Alerts based on Metrics are very easy to handle, you don’t need to create a query
- Alerts based on Metrics support a dynamic threshold, this is very helpful if you don’t know , what is the trend of your dimension
- Alerts based on Metrics support auto-acknowledgement of alerts
These features are only available for the data that comes from these solutions :
- Performance counters for Windows & Linux servers
- Heartbeat records for Agent Health
- Update management records
- Event data logs
How can we create an Alert from Logs using Metrics?
In this sample we will see how we can implement a very common scenario : implement an alarm based on available free memory of a Virtual Machines. We’ll see, how capture the counter of VMs, elaborate and then create the alert.
Procedure:
Enable the Log Analytics agent on the VM and sets the collection of the performance counters
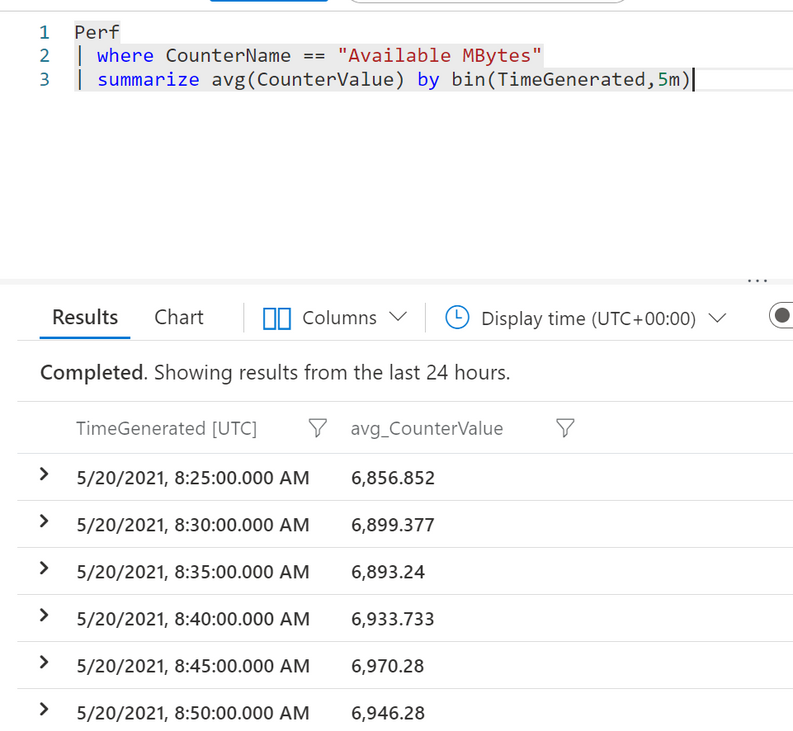
Go to Log Analytics Workspace to check if the data arrives with this query
Perf
| where CounterName == "Available MBytes”
| summarize avg(CounterValue) by bin(TimeGenerated,5m)
| where avg_CounterValue > 5
In this query we check if the data regarding "Available Mbytes” are showing correctly. At the same time we do an aggregation in 5 minute intervals.
After the check you can go to Alerts > Create > Create alert rule > Select the resource (you’ve to select your Log Analytics Workspace)

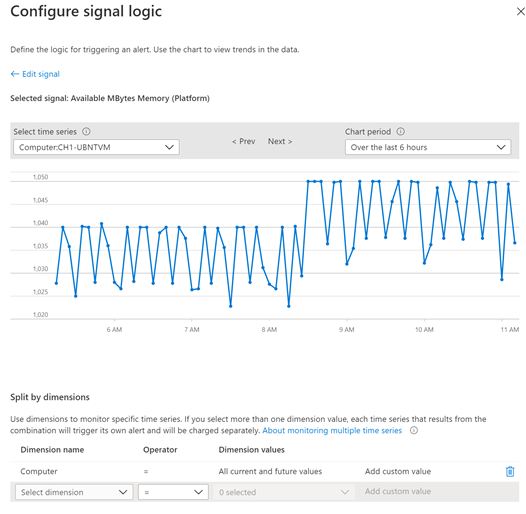
Select Signal Logic, in this case “Available MBytes”, and complete the section “Split by Dimension”.
The meaning of split dimension is that the data arrives in an aggregated way, so you need to split to create useful alerts. In this example, we split the data by computer, so that we can have to measure the available memory for each PC, similar to “Summarize by Computer” in KQL.
All current and future values means that, in this case, all the future computers will be added to this alarm.
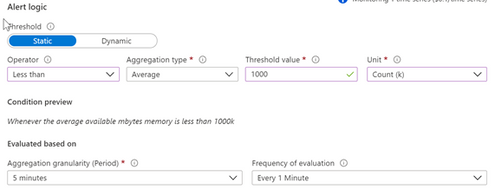
Now you can set your Static or Dynamic threshold
Static threshold :
Dynamic threshold :
Another cool feature is Dynamic Threshold, basically you can decide to use Dynamic Threshold if you don’t know what is the trend of your dimension.
After that you have to complete the name, and the action group of the alert. After that click Save.
Congratulations!, you have created an Azure Alert, using the Logs to Metrics mechanism.
So, we reach the end (of a beautiful story). Thanks for you attention, we’ll see in the next article!
Regards
Edoardo
Posted at https://sl.advdat.com/396i4T3


