Hey, my Azure Percept consumes a lot of messages in Azure IoT fast. How can I control this? Can I deploy a custom logic on the Azure Percept?
Those were the initial questions that we asked once we understood how the Azure Percept worked. Very quickly we noticed the Percept was even sending messages to Azure IoT Hub when no objects were detected with label = null. I still remember we consumed 8000 messages in around 2 hours with the Percept (Azure IoT Hub free tier) – daily limit. We upgraded to S1 Tier but then thought what if we were to scale our solution to include multiple Azure Percepts? How do we ensure we do not use up the daily limit on this tier again?
As a starter, we can control the number of messages that are being sent to IoT Hub through Azure Percept’s azureeyemodule module identity twin. The azureeyemodule is responsible to analyze the unencoded video frames with the deployed machine learning model and send the results to other modules. Controlling how often azureeyemodule sends messages to other modules, e.g. edgeHub, can limit the number of messages being sent to Azure IoT Hub.
To do this:
- Navigate to your Azure IoT Edge device through Azure IoT Hub
- Under Modules section, select ‘azureeyemodule’
- Select ‘Module Identity Twin’
- In the module device twin json, find the property named ‘TelemetryIntervalNeuralNetworkMs’:
5. This value determines how often messages are being sent from the neural network. We can increase this value to limit the number of messages being sent out (remember it is in milliseconds!)
6. Then make sure you press ‘Save’
7. Your Azure Percept will now sync up with the module and read in your updated TelemetryIntervalNeuralNetworkMs desired property value. After few seconds, you should see less frequent messages arriving in IoT Hub.
On point 7, you can easily view what telemetries are being sent (including the text) using Azure IoT explorer (https://docs.microsoft.com/en-us/azure/iot-fundamentals/howto-use-iot-explorer).
The method described above is the easiest way to control the frequency of messages arriving in Azure IoT Hub. With some quick math, we can calculate the ideal 'Telemetry IntervalNeuralNetworkMs' for x number of devices. The downside of this approach: the higher the number, the less ‘real-time’ it becomes.
Our requirement was to send telemetries to Azure IoT Hub as soon as possible once azureeyemodule detects an object. So, the above solution was not suitable for us. This is where Azure Stream Analytics Edge came into the picture…
Azure Stream Analytics edge is designed for low latency, resiliency, efficient use of bandwidth, and compliance. The ability to implement custom logic, including only to send messages to IoT Hub when objects are detected was appealing. As part of the implementation, we will need to modify the routes on the Percept from module-to-module in a specific way as shown below:
Follow these steps to achieve this:
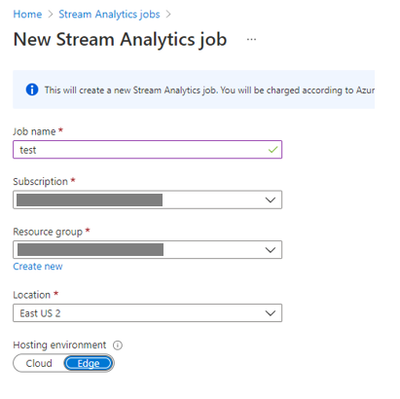
1. Create Stream Analytics job on edge: Go on stream analytics jobs main page and click the ‘Create’ button
2. Give it a name, choose the location and make sure the Hosting environment – edge is selected. Select ‘Create’
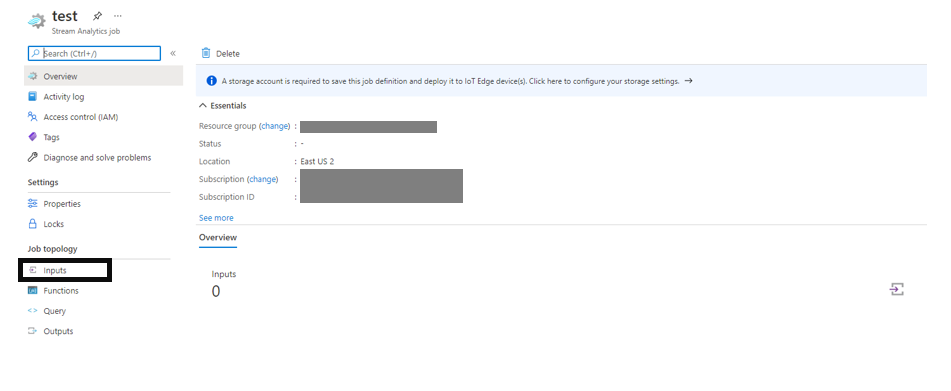
3. Under Job Topology section click on ‘Inputs’:
4. Click on ‘Add stream input’ and select ‘Edge Hub’
5. Enter an input alias name and click 'Save':
6. Select ‘Outputs’, click on ‘Add’ and select ‘Edge Hub’
7. Enter an output alias name and click ‘Save’
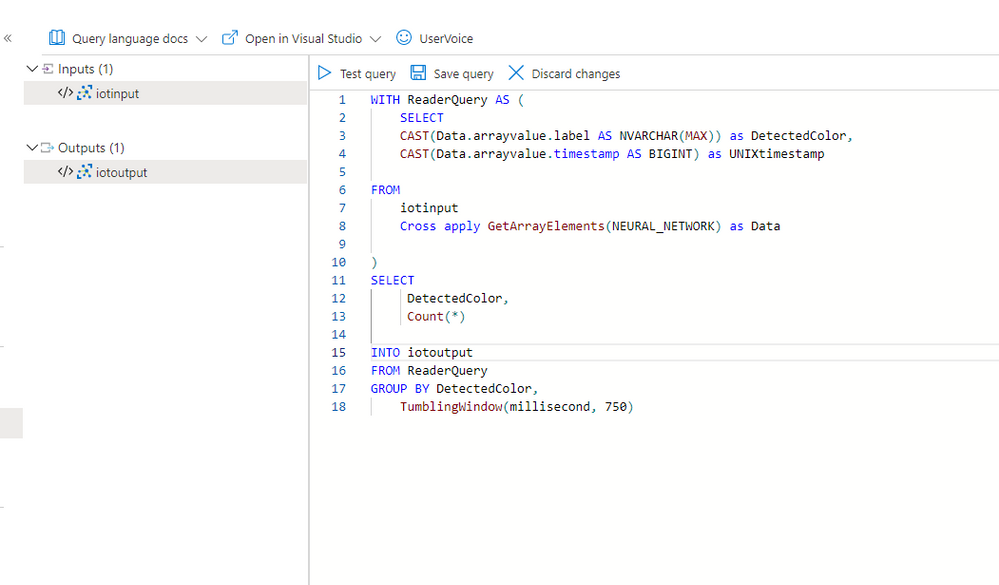
8. Click on Query
9. Write the SQL query for filtering the telemetry messages and save the query (you may want to apply a different logic here):
10. To deploy this logic as an IoT module: Navigate to your Percept device in IoT Hub
11. Click on ‘Set Modules’ button
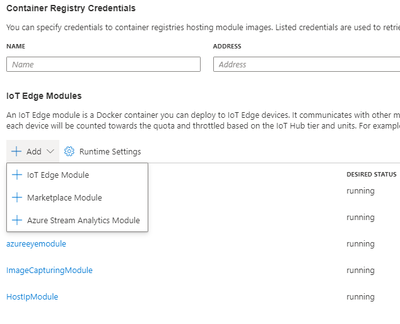
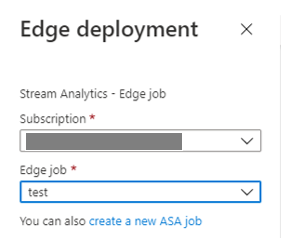
12. Under IoT Edge Modules section click on ‘Add – Azure Stream Analytics Module’:
13. Choose your newly created edge job and click ‘Save’:
14. The ASA edge module will appear under IoT Edge Modules list:
15. Select the ‘Routes’ tab and specify the routes:
16. Click on ‘Review + Create’ button to set the module on device
Now, wait a few seconds (give it a good minute if it’s your first time). To see if things are working, open Azure IoT Explorer and see if you can see telemetry and any additional json properties defined in your SQL syntax (Stream Analytics edge):
If you have any issues, it’s best to use module logs to identify the probable cause. In our experience, the logs were extremely helpful to identify the errors when we hit blockers!
Lastly, I would like to thank my company Kagool for providing us with an Azure Percept and an Azure Subscription!
Posted at https://sl.advdat.com/2VcKIPa

