Automating Data Collection for Memory, CPU, and Disk issues
My name is Susan Buchanan, and I am a Support Escalation Engineer with the Windows Performance Team at Microsoft. Does Performance Data Collection got you singing the Blues? This blog addresses how to troubleshoot High CPU and unaccounted memory usage or memory leak to include identifying and data collection using the CLUE tool written by Clint Huffman. A special thank you to Ron Stock for writing me a bad driver to use in demonstration.
I want to discuss how to perform data collection when an issue may be intermittent, troublesome to catch, ongoing, or even reproducible at will. For many years, data collection was manual, time consuming, and often labor some.
- Can’t seem to capture the right data at the right time?
- Intermittent issues? Reproducible issues?
- Do customers leave data captures on too long, and the log sizes are not useful, or too large?
- Need a foolproof way for end users to capture data that isn’t too complicated?
It's frustrating when you obtain a set of data only to realize you needed an additional dataset and must perform the data capture again. You might start with a RAMMAP and a performance monitor on the first data collection, move to a pool monitor or WPR/Xperf on another collection, and then might realize you also needed a tasklist or to find which drivers were associated with which pool tags you need another set of data collected.
Performance is Complicated! It really is.
Well, those days are gone! Thanks to CLUE which runs an ETW trace in the background until a threshold found in the config.xml is hit and then automagically collects data via Tasks in Task Scheduler! This gives you a more robust view of what has occurred since the data capture shows prior to the event, and then the event in the ETW trace without manual intervention.
CLUE was written by a Microsoft employee who has made this code open source and extensible. You can modify the config.xml to create your own scenarios, increase the data captures, and much more.
CLUE Scenarios/Thresholds
Automatically collects a counter log and ETW trace whenever the following conditions occur:
- Single CPU over 90% for more than 3 seconds.
- Free System PTEs of less than 50000 (kernel address space is low)
- System Committed memory greater than 90% (indicates one or more memory leaks that are consuming the system resources)
- Kernel Pool Paged virtual address space greater than 10% of system committed memory (indicates a driver leak in pool paged)
- Kernel Pool NonPaged virtual address space greater than 10% of physical memory (indicates a driver leak in pool nonpaged)
- Disk latency of greater than 25 ms for 3 or more seconds (includes high consuming processes, disk filter drivers, page file usage, and more)
- High CPU by WMI (includes WMI tracing to identify the query causing it)
- High thermal temperatures (traces CPU and power usage)
- High battery drains greater than 20% of battery capacity within one hour (traces CPU, GPU, and power usage)
- Has a User-initiated trace start optimized for application hangs. The user can initiate a wait analysis trace to determine why Windows, or an application is hanging.
CLUE Installation
Requires administrator rights to install. After installation, non-admin users can use the device normally and data collection will still occur even for user-initiated data collections.
For Windows 10, Windows Server 2016 and 2019
1. Download and setup scheduled Tasks via Microsoft Clue tool 1.1.6: Clue/Clue_1.1.6.zip at master · Clint Huffman/Clue · GitHub
2. Confirm you have 2-4 GB free on your c: drive
3. To install CLUE run setup.bat as administrator
4. Accept the defaults
Data location stored (default)
C:\ClueOutput
Extensibility
CLUE is also extensible allowing for more performance rules by modifying the config.xml without changing the binaries.
GIT:
Following are 2 scenarios describing how CLUE can be useful in troubleshooting High CPU and High Memory.
What is causing high CPU on my server?
Scenario #1: Issue of intermittent high CPU on a Windows Server 2016 where it would jump to > 90%.
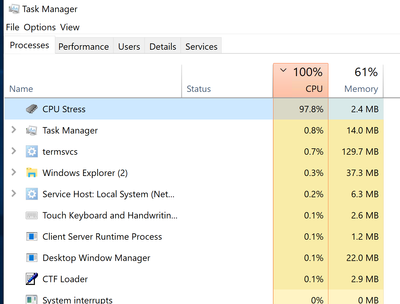
In task manager we can easily see that it is the CPU Stress application; but what if it wasn’t so obvious? What if we needed to drill further down by CPU, or by stack?
Of course, the first line of defense if the issue is occurring in real time is to pop open Task Manager to see what it shows. This is not always possible which is another reason why CLUE comes in handy.
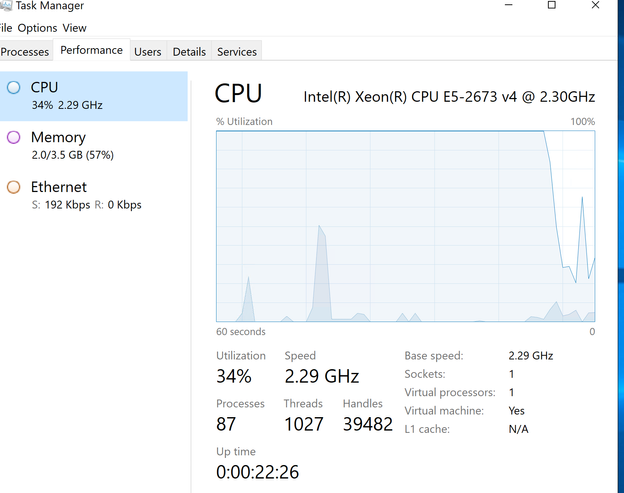
We see from a quick look in Task Manager the CPU is over 90%
Task Manager shows both kernel and user mode in the graph. Kernel mode is in (darker blue/grey area)
But what if the issue wasn’t in state? Or, what if Task Manager wasn’t so helpful?
Luckily, CLUE was running, and we know from the ETW trace what CPU usage looked like prior to and during the occurrence.
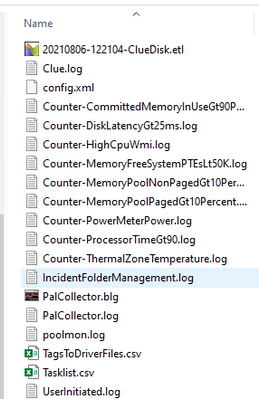
From the C:\ClueOutput folder we see the following data captured due to the ProcessorTime > 90% and DiskLatency > 25ms hit.
When we expand the zipped file for Processor Time > 90%, we see the following data captured:
When we are looking for high CPU, we typically want to look at the following counters:
|
Component |
Performance Aspect being Monitored |
Counters to Monitor |
|
Processor |
Usage |
Processor\ % Processor Time (all instances) Processor\% DPC Time Processor\% Interrupt Time Processor\% Privileged Time Processor\% User Time |
|
Processor |
Bottlenecks |
Processor\% Processor Time (all instances) Processor\% DPC Time Processor\% Interrupt Time Processor\% Privileged Time Processor\% User Time Processor\Interrupts/sec Processor\DPC’s Queued /sec System\Context switches /sec System\System Calls/sec System\Processor Queue Length (all instances) |
Processor
|
Counter Name |
Metric |
|
Processor Queue Length (PQL) |
Divide the PQL into the number of processors ~2+ sustained per processor and high CPU present: Check processes for high CPU consumption, also check Context Switching, % DPC Time, and % Interrupt Time
|
|
% Processor Time |
0-50% healthy 50-80% monitor / warning Monitor 80-100% critical. System may appear sluggish. |
|
% DPC Time |
~% Processor Time > 85% and % DPC Time > ~15%: investigate if they are constantly above these levels, short spikes are ok. If only on 1 processor ~100% Processor Time and ~50%+ DPC Time: |
|
% Interrupt Time |
High CPU Interrupt Time – more than ~30% interrupt time (A high amount of % Interrupt Time in the processor could indicate a hardware or driver problem). Very high CPU Interrupt Time – more than ~50% interrupt time (A very high amount of % Interrupt Time in the processor could indicate a hardware or driver problem) |
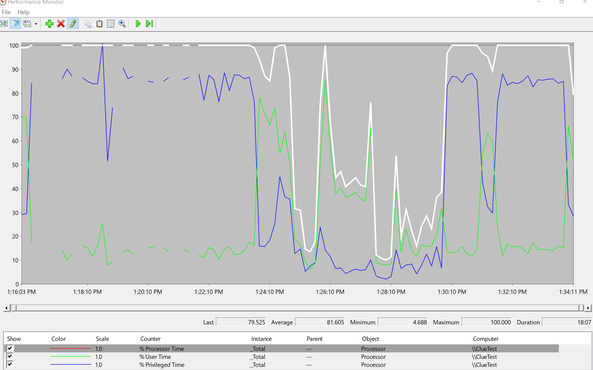
Wow – our processor time is significantly high for much of our 6-minute performance monitor.
Check out the Processor Queue Length which is > 10 on average. That’s not looking good here. So, let’s drill down into who is using the %Processor Time.
Processor Minimum Maximum Average
=========================================================================
% Processor Time : 4.688% | 100% | 81.605%
When we add counters for Processor/%ProcessorTime and look at the instances we quickly see CPUStres64.exe is the highest consumer. There are even gaps where the %ProcessorTime exceeded 100 percent and went to around 180% in the data.
% Processor Time Minimum Maximum Average
=========================================================================
- CPUSTRES64 : 0% | 180.309% | 19.787%
From the CLUE ETL (Windows Performance Recorder trace), we see the highest CPU is 0. Ok, in my example I only have 1 CPU – but it’s good to check if the CPUs are being consumed equally.
In another example, where I have multiple processors and CPUStres64.exe is the culprit we see where each processor is hit fairly, equally by the process.
Where did all my Memory Go? And why did my Server become unresponsive?
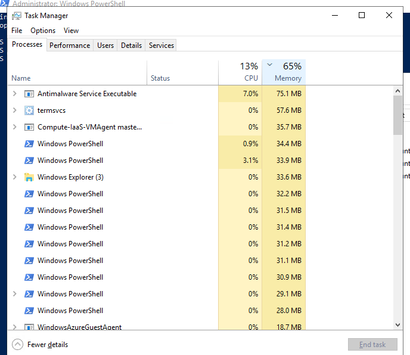
Scenario #2: Windows server 2019 that inevitably runs us of memory due to a resource depletion, but we cannot figure out why?
Looking at task manager is leaving you without a "clue" as the top consumer is just 75 MB.
If we were to manually gather the data, it would look like this:
Obtain a perfmon to determine there is a memory issue. Oh, there is, but now I need more data.
I might look at the following counters.
|
Memory |
Usage |
Memory\ Available Bytes |
|
Memory |
Bottlenecks or leaks |
Memory\ Pages/sec Memory\ Page Output or Write/sec Memory\ Pool Paged Resident Bytes |
Memory - some metrics to keep in mind when you look at the data.
|
Counter Name |
Metric |
|
Available Bytes |
Minimum value: ~700mb – monitor ~500 mb or less - critical |
|
Pool Paged Bytes (PP) |
Exhausted: Event 2020 logged in system log. Both 2019 and 2020 event log errors with a source of SRV are relatively common and indicate a depletion of non-paged or paged pool memory respectively. |
|
Pool Nonpaged Bytes (NPP) |
Exhausted: Event 2019 and 2004 logged in system log. NPP can exhaust and it causes more of a problem if high or pool tag is leaking resulting in low memory condition on the system. Check usage if available memory is low on the OS
|
|
Free System PTEs |
Rarely if at all will a 64-bit machine run out of PTEs as normally available is in the tens of millions. Available PTEs value is few hundred thousand: monitor Available PTEs value is 10,000 or less: critical |
|
Handle Count |
Exchange, SQL and LSASS can have 100k + and be normal. Other software or processes high are worth investigating. Rule of thumb is 1500 – 2000 is a good place to being looking at those applications consuming a lot more than this number. |
|
Thread Count |
~500+ possible unexpected behavior: monitor ~2000+: warning |
|
% Committed Bytes Used |
~90% but may only be relative if low available memory present |
|
Pages/sec |
~1000+ could be start of running out of memory: monitor ~2500+ could be experiencing system wide delays: Check available memory ~5000+ most likely experiencing system wide delays: Check available memory and memory used by individual processes
|
The manual way which would be lengthier and more time consuming would be to:
- Obtain a poolmon to determine what tag might be leaking. Okay, there is a leak, but now I need more data.
- Use FindStr to try and identify what tags are being used by what files (unfortunately, we rebooted the box, and we had to start all over with the data captures).
- Obtain Tasklist to determine the services in use
- May need an ETL or even a dump after that.
Here’s CLUE to the rescue. CLUE was running a Perfmon trace and noticed that NonPaged Pool consumption was > 10% for the following tags: LEAK and MxGN. It then automagically collects data needed to help you isolate this further (like Perfmon, Poolmon, and in some instances an ETL trace).
Looks like my good friend, Ron wrote me a bad driver that was allocating but not deallocating my memory using the LEAK Tag.
*Normally I would show a larger time frame between poolmon data, but this is just for demo purposes. Clearly you see in a matter of minutes the number of Frees is 0 and the number of Bytes is growing.
LeakyFlt is bad news as it’s borrowing the OS’s memory and never freeing it. The OS expects for applications to borrow memory and resources, but they should deallocate/Free it as well.
2021.08.11-02:08:20 UTC (local time of the PC where this was collected)
Memory: 3669556K Avail: 1492408K PageFlts:4060786 InRam Krnl: 9468K P:77912K
Commit:2783988K Limit:4586800K Peak:3077384K Pool N:536064K P:84252K
Tag Type Allocs Frees Diff Bytes Per Alloc
LEAK Nonp 340 0 340 356515840 1048576
MxGn Nonp 7985 6436 1549 55044672 35535
2021.08.11-01:57:13 UTC (local time of the PC where this was collected)
Memory: 3669556K Avail: 1529880K PageFlts:2763623 InRam Krnl: 9480K P:67448K
Commit:2544788K Limit:4586800K Peak:2546588K Pool N:372744K P:74848K
Tag Type Allocs Frees Diff Bytes Per Alloc
LEAK Nonp 200 0 200 209715200 1048576
MxGn Nonp 4750 3201 1549 55044672 35535
Clue stepped up and in the TagstoDrivers Folder even tried to help identify what files might be using the tags.
So, I stopped the service that was using LeakyFlt.sys and BAM the problem is solved.
Would you like a way to automate your data captures? Would you like a way to gather data on intermittent issues? Ongoing Issues? Reproducible Issues? Tired of manually setting up tools for data capture? Or can’t seem to stop a trace in time? Then CLUE may just be the tool for you.
Posted at https://sl.advdat.com/3FKdn0b

