Have you ever wanted to monitor or set up alerts for Service Fabric applications and its services when it crosses certain threshold in terms of memory or CPU utilization? Then this blog will help you set up performance counters for Service Fabric services and further you can set up alerts based on trigger condition.
Note:
I would strongly suggest to review How to set up Azure Monitor in Service Fabric Cluster to monitor and diagnose a cluster using events - Microsoft Tech Community if you’re looking for setting up Log Analytics for monitoring SF cluster based on Service Fabric events.
You can follow the below steps to enable performance counters for individual services:
- We need to create a Log Analytics workspace if not created already. Ref: https://docs.microsoft.com/en-us/azure/azure-monitor/logs/quick-create-workspace
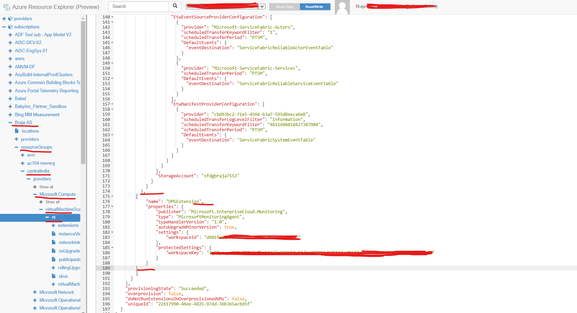
- Then you can use the Log Analytics Workspace ID and key to install OMS extension on all the VM scale sets part of the SF cluster, you can use resource explorer (https://resources.azure.com) to do this change:
Go to https://resources.azure.com/ -> Subscription -> Resource Group -> Microsoft.Compute -> Click on associated VMSS resource name.
You need to install the extension with following details on all VMSS associated with a particular cluster:
{"name": "OMSExtension",
"properties": {
"autoUpgradeMinorVersion": true,
"publisher": "Microsoft.EnterpriseCloud.Monitoring",
"type": "MicrosoftMonitoringAgent",
"typeHandlerVersion": "1.0",
"settings": {
"workspaceId": "enter workspace id here",
"stopOnMultipleConnections": "true"
},
"protectedSettings": {
"workspaceKey": "enter Key value"
}
}
}
Do a PATCH operation using above details on the VMSS:
- After PATCH, wait for the VMSS extension update to complete. After the extension is successfully provisioned, you start seeing all the VMs (part of VMSS) in connected agent blade of the log analytics workspace.
- After you see the VMs in connected state, you can go Agents Configuration blade of log analytics workspace to indicate which counters you would like the OMS Agent to collect for example below:
Above shown counters are few sample counters; you can add counters based on your requirement. - After the counters are added, wait for few minutes for counters data to get collected, you can then go to Logs blade of log analytics workspace, there you’ll see Perf table which will have data of configured counters.
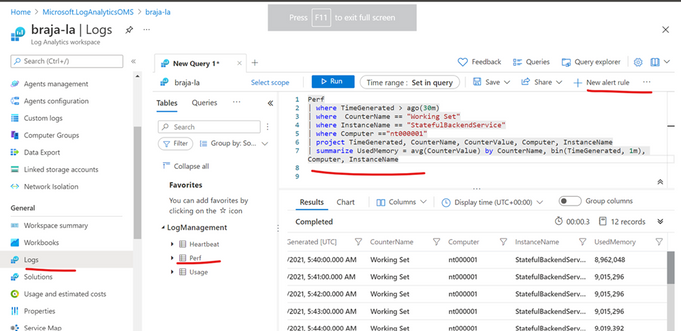
You can then use different query and can set an alert based on your query on it like below
A service fabric application consists of multiple services, those services run as a process inside the VM, with these performance counters, you can see memory and CPU utilization of each process per node.
Few examples query:
- If you would like to know the memory (Working Set) of an individual process per node, you can use query:
Perf
| where TimeGenerated > ago(30m)
| where CounterName == "Working Set"
| project TimeGenerated, CounterName, CounterValue, Computer, InstanceName
| summarize UsedMemory = avg(CounterValue) by CounterName, bin(TimeGenerated, 1m), Computer, InstanceName
- If you would like to see the CPU utilization of all individual services:
Perf
| where TimeGenerated > ago(15m)
| where ( ObjectName == "Process" ) and CounterName == "% Processor Time"
| summarize AggregatedValue = avg(CounterValue) by Computer, InstanceName
| render table
For more on queries, you can check here: https://docs.microsoft.com/en-us/azure/azure-monitor/logs/get-started-queries
You can tweak the query based on your requirement and then can set up alerts by clicking on “New Alert Rule” in the query editor.
While with above, you can monitor the CPU/Memory utilization of the services, do check the Log Analytics pricing for cost of using this performance counters feature. Thank you!
Posted at https://sl.advdat.com/3GpzOrl


