Database Migration Service (DMS) is an Azure service designed to improve the database migration experience. Users can leverage DMS through the Azure SQL Migration extension for Azure Data Studio. More can be read about this extension at the following link: Migrate using Azure Data Studio | Microsoft Docs.
With the goal being to restore database backups to a target database, the first step is to copy backups into an Azure storage container. Users can do this on their own or may wish to leverage the Integration Runtime (IR). The IR is a tool that copies backups from on-premise to an Azure storage container. Once backups are in a container, they can be restored to Azure Virtual Machine (VM) and Managed Instance (MI) targets.
Both IR speed and restore speed will affect the end-to-end migration performance. Our tests aim to measure how well the IR and restore scale individually, therefore we've split our tests into two parts: IR Scale Test and Restore Scale Test.
For our tests, we used two different databases of sizes 50 GB and 400 GB. For each database, we tested with 1 stripe backups and 10 stripe backups, meaning backups split into 10 separate files.
The results collected below are only for the configurations mentioned being run in our own testing environments. It's meant to get a general idea of how performance scales and exact times may differ due to the internet bandwidth, CPU, memory, and other factors in IR nodes and/or target VM/MIs.
IR Scale Test
Our IR scale test includes many individual test cases with different combinations of test configurations. We have below 4 dimensions of test configurations:
IR node count: 1 vs 4
IR node vCPU count: 4 vs 8 vs 16 vs 32 (all test nodes/VMs are Dv3 series Dv3 and Dsv3-series - Azure Virtual Machines | Microsoft Docs)
Database base size (compressed backup size): 50 GB (8G) vs 400 GB (68G)
Stripe count: 1 vs 10
In summary, we have 2 * 4 * 2 * 2 = 32 combinations of test configurations.
| Test Configuration Id (0~31) |
1 stripe 4 vcpu |
1 stripe 8 vcpu |
1 stripe 16 vcpu |
1 stripe 32 vcpu |
10 stripe 4 vcpu |
10 stripe 4 vcpu |
10 stripe 16 vcpu |
10 stripe 32 vcpu |
| 1 IR, 50 GB | 0 | 1 | 2 | 3 | 4 | 5 | 6 | 7 |
| 1 IR, 400 GB | 8 | 9 | 10 | 11 | 12 | 13 | 14 | 15 |
| 4 IR, 50 GB | 16 | 17 | 18 | 19 | 20 | 21 | 22 | 23 |
| 4 IR, 400 GB | 24 | 25 | 26 | 27 | 28 | 29 | 30 | 31 |
For each test configuration, we'll try to run 10/20/40/80 concurrent migrations. However, if the IR node count is 1, we will not run 40/80 concurrent migrations, as IR will be at its capacity and may easily be rate limited. We have 16 test configurations with 1 IR node, and 16 test configurations with 4 IR nodes. So there are 16 * 2 + 16 * 4 = 96 different test cases.
We'll denote a test case as "x-y", where "x" represents the test configuration id, and "y" represents the number of concurrent migrations. E.g. test case "8-10" uses the test configuration id "8" and "10" concurrent migrations will be triggered with this test configuration.
To expand a bit more on the test case "8-10", we need to create 1 IR node with 4vcpu, use the 400 GB database with 1-stripe backup, run 10 concurrent migrations (with the same database and backup), and collect the metrics.
Copy Duration - 1 IR
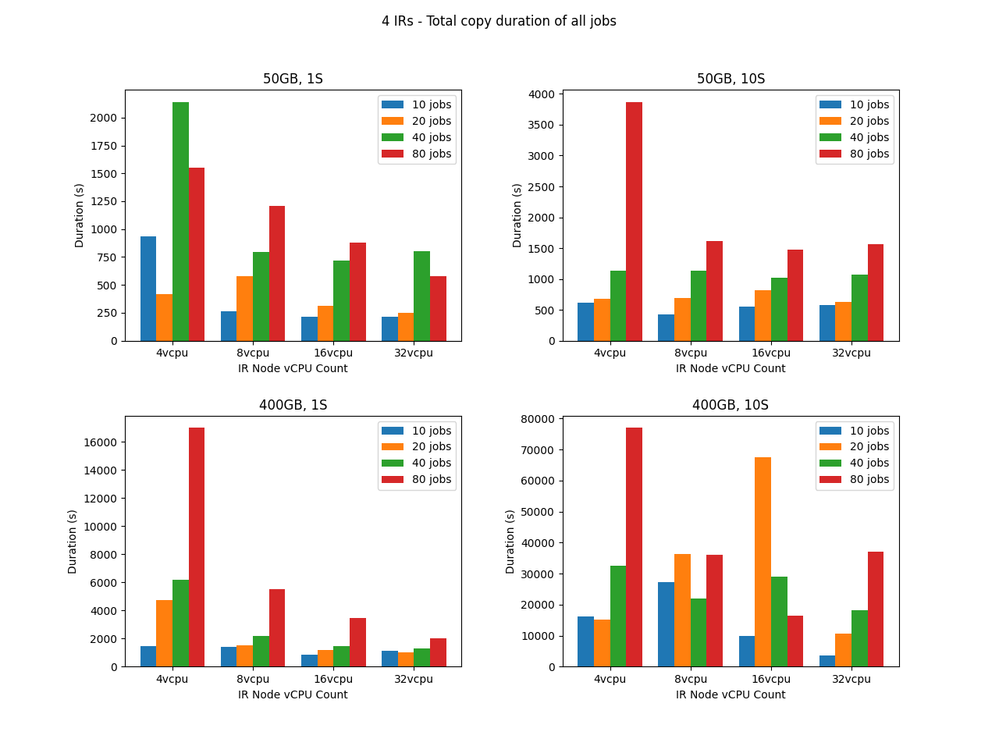
The below chart shows us the total copy duration for all test cases with 1 IR node.
Let's take a look at the bottom-left subplot (Title: 400GB, 1S) above, it shows us the total copy duration of these 8 cases:
- 8-10 (4vcpu, blue), 8-20 (4vcpu, orange)
- 9-10 (8vcpu, blue), 9-20 (9vcpu, orange)
- 10-10 (16vcpu, blue), 10-20 (16vcpu, orange)
- 11-10 (32vcpu, blue), 11-20 (32vcpu, orange)
When comparing 8-10, 9-10, 10-10, 11-10 (the 4 blue bars) or 8-20, 9-20, 10-20, 11-20 (the 4 orange bars), we can conclude that:
- Rule 1 - the more vCPU count an IR node has, the less time is needed to copy the backup files.
When comparing 8-10, 8-20 (the blue bar and orange bar in the 4vpu group), or any pair of the blue and orange bars in the same vcpu group, we can conclude that:
- Rule 2 - the more concurrent jobs for the same test configuration, the more time is needed to copy the backup files.
However, when looking at other subplots, this is not always true.
E.g. In the upper-right subplot (Title: 50 GB, 10 S), the copy duration does not show a significant difference when changing the number of vCPU or number of concurrent jobs. It has something to do with the file size and scheduling in IR. the file size are relatively small and the time to copy each stripe backup is very fast, more portion of time is used for scheduling which is affected by different factors and hard to predict.
However, in the bottom-right subplot (Title: 400GB, 10S), the result seems counterintuitive. E.g. 8vcpu takes way more time copying backups than 4vcpu. Also 16vcpu copies 20 jobs faster than copying 10 jobs. Such results are heavily affected by the following factors:
- Number of copying jobs actively running in the IR node
- Connection stability and copying throughput between IR node and backup share folder
Such factors are very different in different tests, that's why our testing results are for reference only, your actual copy duration might be very different even if you have the same test configurations.
Copy Duration - 4 IR
The below chart shows us the total copy duration for all test cases with 4 IR nodes.
Overall, the results for 4 IR test cases are more reasonable, for 50GB, 10S and 400GB, 1S, it mostly follows Rule 1 and Rule 2. While for 500GB, 1S and 400GB, 10S, the results are more random, affected by the factors we mentioned above.
IR Node Metrics - 1 IR
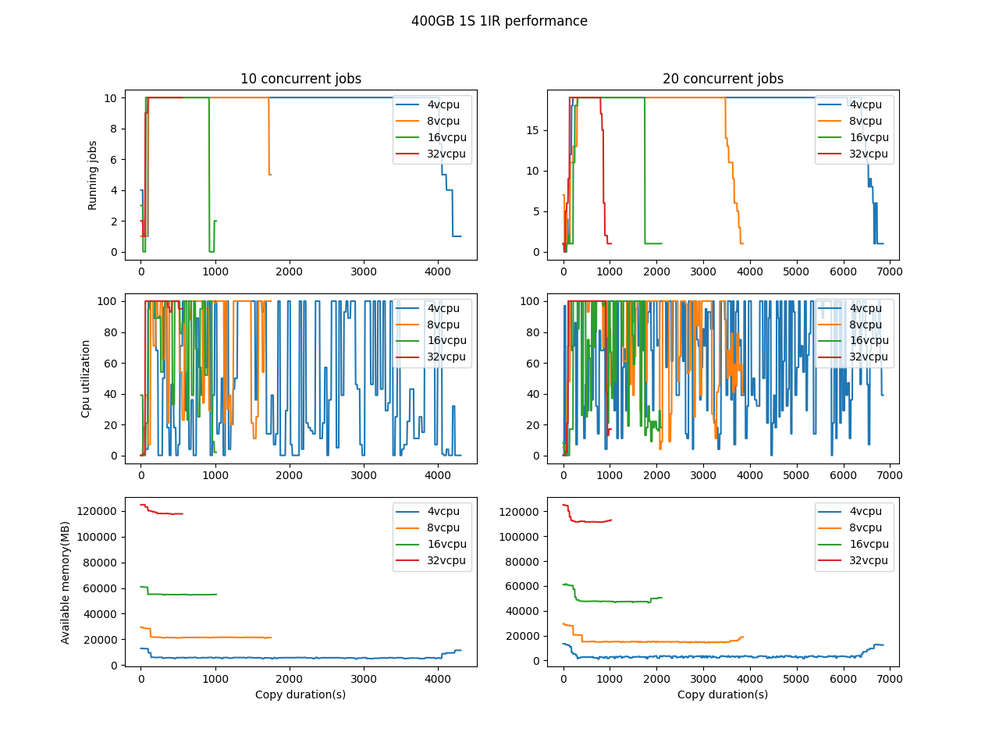
The below 2 charts show us the IR node metrics for 50 GB, 1 Stripe and 50 GB, 10 Stripe with 1 IR node.
For each chart, the X-axis represents copy duration. while Y-axis has different meanings:
- For the 1st row, Y-axis represents the number of active copying jobs running
- For the 2nd row, Y-axis represents the percentage of CPU utilized
- For the 3rd row, Y-axis represents the amount of memory available in the IR node
Each line in each subplot represents a test case. e.g. the top-left subplot (Title: 10 concurrent jobs) in the 1st chart comes from 4 test cases:
- 0-10 (4vcpu, blue)
- 1-10 (8vcpu, orange)
- 2-10 (16vcpu, green)
- 3-10 (32vcpu, red)
Regardless of the number of concurrent jobs and number of stripes, CPU utilization is always fluctuating throughout the copying process, jumping between 0 and 100. On the other hand, available memory is always very steady, decreases a bit when copying jobs are busy, and increases a bit when some copying jobs are finished.
Active running jobs are a bit different when the number of stripes changes. In the 1st-row subplots of the 1st chart (50GB, 1S), active running jobs are more stable compared to 1st-row subplots of the 2nd chart (50GB, 10S), which is more fluctuating. We also mentioned why this is happening in the above section.
The individual backup size of the 50GB, 10S database is smaller and takes very little time to copy over to the storage container. When one job finishes, a new job needs to be scheduled. So the number of active jobs changes all the time.
While for 50GB, 1S database, the file size is relatively larger and takes a longer time to copy over to the storage container. So the number of active jobs is more stable.
A similar pattern can be observed in the below 2 charts for 400 GB, 1 Stripe and 400 GB, 10 Stripe with 1 IR node.
IR Node Metrics - 4 IR
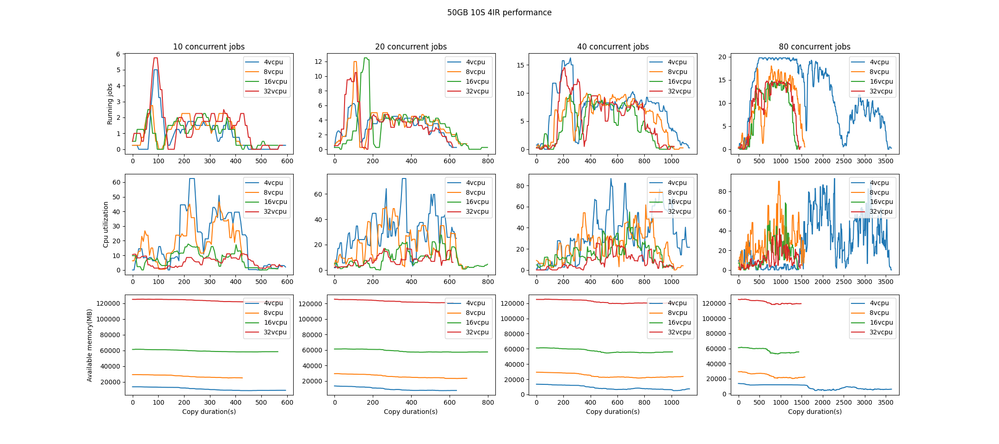
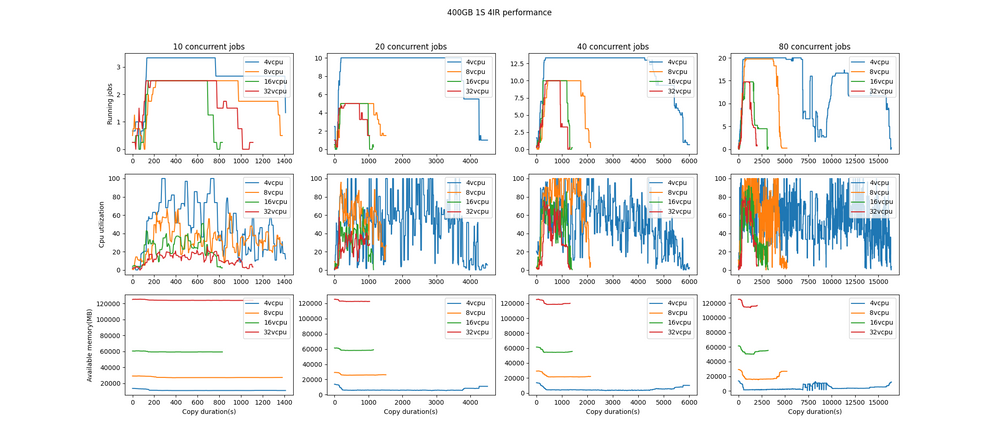
Below 4 charts show us the IR node metrics for 50 GB, 1 Stripe, 50 GB, 10 Stripe, 400GB, 1 Stripe, and 400GB, 10 Stripe with 4 IR nodes. all the Y-axis values at any point in time in the process are the average values among 4 IR nodes.
We can find a very similar pattern regarding the number of running jobs, as well as CPU utilization and available memory.
However, there are still some spikes due to random incidents like IR not effectively scheduling jobs, or data returned from metrics API not being complete for a short while.
Restore Scale Test
In addition to testing 50GB and 400GB backups with 1 and 10 stripes, restore tests also test multiple concurrent migrations. For these tests we did not use an IR, instead, we started with backups already in an Azure storage container. In cases where we ran more than one concurrent migration, we started these migrations with a 10-second delay between them, restoring the same backup multiple times to the same target. The metrics listed below represent the difference in time between the first migration beginning and the last migration ending.
Managed Instance
MI Pricing Tier: General Purpose Standard-series (Gen 5) (32 GB, 4 vCores, Geo-redundant backup storage)
|
Concurrent Migrations (MI) |
50GB - 1 Stripe |
50GB - 10 Stripe |
400GB 1 Stripe |
400GB 10 Stripe |
|
1 |
00:05:02.8540000 |
00:05:02.7000000 |
00:25:11.3000000 |
00:26:11.3560000 |
|
2 |
00:05:03.1600000 |
00:05:03.1000000 |
00:24:11.7730000 |
00:26:15.4730000 |
|
4 |
00:06:04.3030000 |
00:06:04.7360000 |
00:37:29.0940000 |
00:37:19.6360000 |
|
8 |
00:10:06.8400000 |
00:10:07.0800000 |
01:14:32.4060000 |
01:12:31.5860000 |
|
10 |
00:12:17.8100000 |
00:12:11.3370000 |
01:35:33.1400000 |
01:31:48.1370000 |
Virtual Machine
VM Size: Standard D8s v3 (8 vcpus, 32 GiB memory)
|
Concurrent Migrations (VM) |
50GB - 1 Stripe |
50GB - 10 Stripe |
400GB 1 Stripe |
400GB 10 Stripe |
|
1 |
00:08:12.9630000 | 00:08:13.1370000 | 00:45:19.1500000 | 00:35:18.4430000 |
|
2 |
00:16:02.7660000 | 00:14:35.5830000 | 01:40:03.7300000 | 01:40:01.4030000 |
|
4 |
00:28:07.7000000 | 00:28:09.3300000 | 03:36:26.5030000 | 03:45:17.8200000 |
|
8 |
00:49:34.4640000 | 00:55:05.0470000 | 08:12:04.4500000 | 08:11:26.3430000 |
|
10 |
01:45:57.7360000 | 01:22:59.3100000 | 10:22:52.3270000 | 10:21:38.5300000 |
Observing the tables above, we can see how the total migration time typically increases as the number of concurrent migrations increases. We can also see how the different database sizes affect the total migration time.
Posted at https://sl.advdat.com/3KKIx9Zhttps://sl.advdat.com/3KKIx9Z


