Continuing on the topic of High Availability and Failover Groups from the previous posts on How-to determine the SQL MI Failover Group configuration & How-to determine the SQL MI Failover Group & HA Replicas Details, in this how-to we shall see how to monitor the high availability of the available replicas as well as the Failover Group connection between Azure SQL Managed Instances.
If you are interested in other posts on how-to discover different aspects of SQL MI - please visit the http://aka.ms/sqlmi-howto, which serves as a placeholder for the series.
First of all the easiest way of monitor the current status of the databases is to use the sys.dm_hadr_database_replica_states DMV by looking at the [syncrhonization_health], [database_state] and [is_suspended] columns representing the information about different aspects of health for each of the databases on each of the visible replicas - either local or remote, as in the case of the Failover Group.
Additionally an important part of monitoring is an action of looking at the replay lag that is taking place on the secondary replicas and for that purpose the column [secondary_lag_seconds] exists, representing the lag time in seconds.
The final result for the first query is rather simple - representing an average lag on the secondary replicas (which value and especially value growth we should observe with care), and a count of non-healthy and suspended replicas:
SELECT DB_NAME(database_id) as DatabaseName,
	AVG(secondary_lag_seconds*1.0) as AVGSecondaryLagSeconds,
	SUM( CASE WHEN synchronization_health <> 2 THEN 1 ELSE 0 END ) as NonHealthyReplicas,
	SUM( CASE WHEN database_state <> 0 THEN 1 ELSE 0 END ) as NonOnlineReplicas,
	SUM( CASE WHEN is_suspended <> 0 THEN 1 ELSE 0 END ) as SuspendedReplicas
	FROM sys.dm_hadr_database_replica_states
	GROUP BY database_id
	ORDER BY DB_NAME(database_id);
The expected result for the healthy replica situation (no matter if there are multiple active replicas or if a failover group is involved or not) is presented below, where there is no Lag for replicating information and there is no replica with any potential problem:
Catching a an unhealthy situation will look similarly to the picture below, where I have provoked the resizing of the Primary Replica and the db4 database was not considered healthy on one of the replicas:
Knowing which database(s) is having problems, as the next step, you might need to determine which replica(s) are affected and for that purpose you can use the following query, which will help you understand the exact nodes and the respective problem it is facing:
SELECT CASE WHEN fabric_replica_role_desc IS NOT NULL THEN fabric_replica_role_desc ELSE link_type END as ReplicaRole,
	CASE WHEN replication_endpoint_url IS NOT NULL THEN replication_endpoint_url ELSE partner_server END as EndpointURL,
	synchronization_state_desc, is_commit_participant, synchronization_health_desc,
	is_suspended, suspend_reason_desc,
	DB_NAME(repl_states.database_id) as DatabaseName,
	repl_states.database_state_desc,
	seedStats.internal_state_desc as SeedingStateDesc
	FROM sys.dm_hadr_database_replica_states repl_states
       LEFT JOIN sys.dm_hadr_fabric_replica_states frs
                     ON repl_states.replica_id = frs.replica_id
              LEFT OUTER JOIN sys.dm_hadr_physical_seeding_stats seedStats
                     ON seedStats.remote_machine_name = replication_endpoint_url
                     AND (seedStats.local_database_name = repl_states.group_id OR seedStats.local_database_name = DB_NAME(database_id))
              LEFT OUTER JOIN sys.dm_hadr_fabric_continuous_copy_status fccs
                     ON repl_states.group_database_id = fccs.copy_guid
	ORDER BY ReplicaRole DESC, DatabaseName
This query will help you to determine for each of your databases if there are any unhealthy replicas (meaning that something wrong is going and quite possible the synchronization process is not working) or maybe some of the replicas are not online (maybe there was a problem with one of the secondary replicas or a on Business Critical service tier, for example) and if any of the replicas is suspended.
Also it will help you to determine eventual synchronization problems if the replica is an active secondary, but the [synchronization_state_desc] is SYNCHRONIZING instead of SYNCHRONIZED as expected, or the active seeding is taking place.
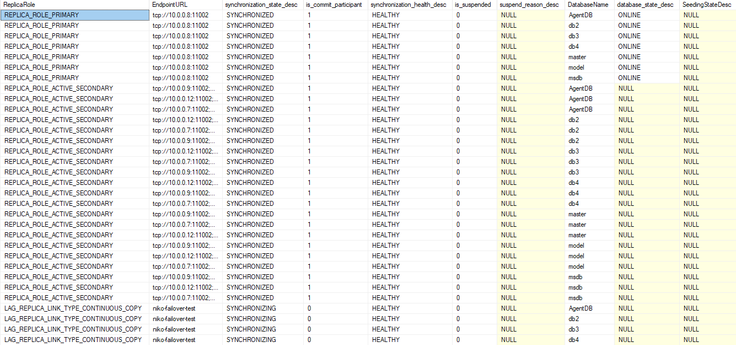
A healthy situation of the same initial configuration is presented on the picture below:
Ordered by the Replica Role (Primary, Secondary and Failover Group respectively) and the database name, you can see determine precisely which replica is having a problem.
A non-problematic situation, where actually the scaling operation is running (SLO update) is represented below - while there is a seeding for the new replica is taking place, there are 2 types of the replicas - LAG_REPLICA_LINK_CONTINUOS_COPY and LAG_REPLICA_LINK_TYPE_UPDATE_SLO, with the new one is showing being not yet completely healthy while being built and seeded:
On the image below you have a partial screenshot of this situation.
For troubleshooting more details on the replication between replicas, the following query which provides the habitual details on replication timestamps for commit, hardened and redone operations as well as the log send and redo queue sizes, can be used:
SELECT CASE WHEN fabric_replica_role_desc IS NOT NULL THEN fabric_replica_role_desc ELSE link_type END as ReplicaRole,
	CASE WHEN replication_endpoint_url IS NOT NULL THEN replication_endpoint_url ELSE partner_server END as EndpointURL,
	DB_NAME(repl_states.database_id) as DatabaseName,
	synchronization_state_desc,
	synchronization_health_desc,
	CASE WHEN secondary_lag_seconds IS NOT NULL THEN secondary_lag_seconds ELSE replication_lag_sec END as lag_in_seconds,
	last_commit_time,
	last_hardened_time, last_redone_time, DATEDIFF( MS, last_commit_time, last_redone_time) / 1024. as LastRedoDelaySec,
	log_send_queue_size, redo_queue_size
	FROM sys.dm_hadr_database_replica_states repl_states
		LEFT JOIN sys.dm_hadr_fabric_replica_states frs
            ON repl_states.replica_id = frs.replica_id
		LEFT OUTER JOIN sys.dm_hadr_fabric_continuous_copy_status fccs
            ON repl_states.group_database_id = fccs.copy_guid
	ORDER BY DatabaseName, ReplicaRole DESC;
The good, healthy result is presented on the picture below, with ordering by the name of the database and the respective Replica role:
Note that these are the queries that can be expanded with more information and details and for better commodity can be enhanced with filters for showing just the databases and/or replicas that having problems, as for example adding the following filter condition to the second query will show only the databases which synchronization health is not HEALTHY or the databases which are not ONLINE or the databases where are asynchronous while they should be synchronous or the databases which are suspended:
	WHERE ( ( synchronization_health <> 2 )
		     OR
			 ( database_state <> 0 )
			 OR
			 ( synchronization_state <> 2 AND is_commit_participant = 1 )
			 OR
			 (is_suspended = 1) )
This post ends the this little sub-series of the 3 posts with a focus on the High Availability and Failover Groups configuration and troubleshooting on the SQL Managed Instance, but certainly, in the future, we shall be adding more how-tos to this topic.
Posted at https://sl.advdat.com/2WBAnNu


